Figures & data
Figure 1 Example DCE choice task.
Notes: Example of DCE choice task for oncologists. Wording differed between stakeholders; non-clinical language was used in the choice tasks completed by patients and payers.
Abbreviations: DCE, discrete-choice experiment; ECG, electrocardiogram; PO, orally; QD, daily.
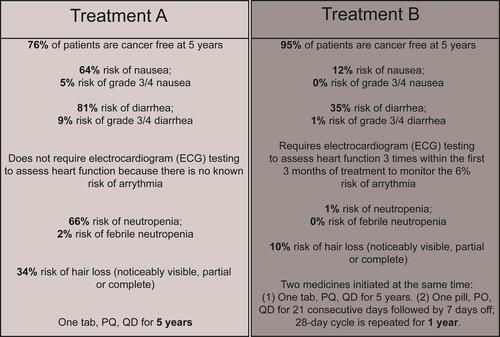
Table 1 Attributes and Levels Included in the DCE
Table 2 Sample Characteristics: Patients and Oncologists
Table 3 Sample Characteristics: Payers
Figure 2 Preference weights for (A) patients, oncologists and (B) payers.
Notes: Preference weights with 95% CIs were estimated by hierarchical Bayesian logistic regression models with effects coding. *Two medicines initiated at the same time: One tab, PO, QD for 5 years, one pill, PO, QD for 21 consecutive days followed by 7 days off; 28-day cycle is repeated for 2 years. **Two medicines initiated at the same time: One tab, PO, QD for 5 years, one pill, PO, QD for 21 consecutive days followed by 7 days off; 28-day cycle is repeated for 1 year.
Abbreviations: CI, confidence interval, DCE, discrete-choice experiment; ECG, electrocardiogram; G, grade; GI, gastrointestinal; iDFS, invasive disease-free survival, PO, orally; QD, daily.
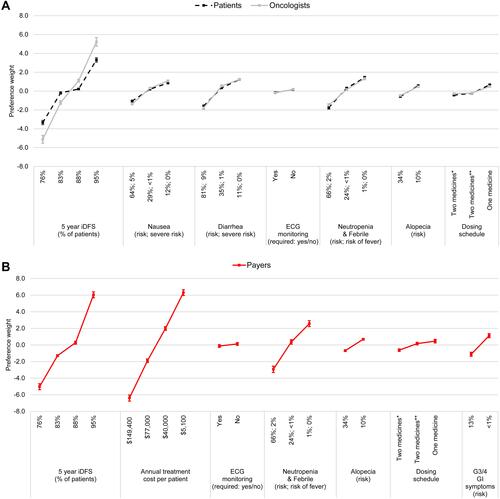
Figure 3 Improvement in iDFS required to accept a change from the most to the least favorable safety and dosing attribute-levels among patients and oncologists.
Note: Percentage-point increase shown is over the base level of 76% iDFS.
Abbreviations: ECG, electrocardiogram; iDFS, invasive disease-free survival.
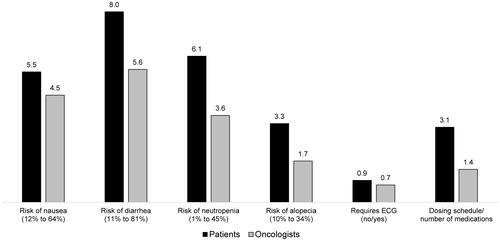
Figure 4 Improvement in iDFS required to accept a change from the most to the least favorable safety and dosing attribute-levels among payers.
Note: Percentage-point increase shown is over the base level of 76% iDFS.
Abbreviations: ECG, electrocardiogram; G, grade; GI, gastrointestinal; iDFS, invasive disease-free survival.
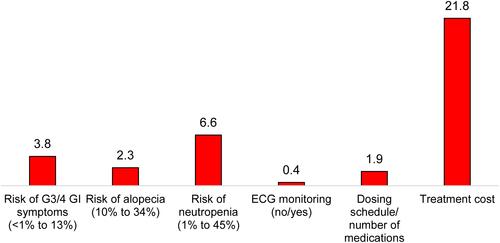
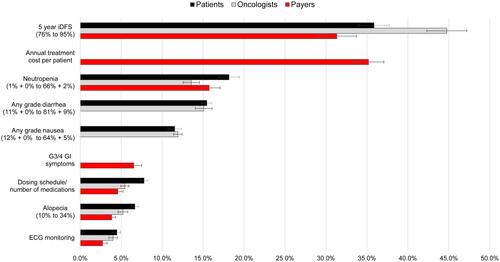
Figure 5 Relative attribute importance for patients, oncologists and payers.
Note: Relative importance estimates are shown with 95% CIs.
Abbreviations: CI, confidence interval; DCE, discrete-choice experiment; ECG, electrocardiogram; G, grade; GI, gastrointestinal; iDFS, invasive disease-free survival.