Figures & data
Table 1 Sample Characteristics (N=167)
Figure 1 Standardized factor loading and residuals for the items of the PCSS.
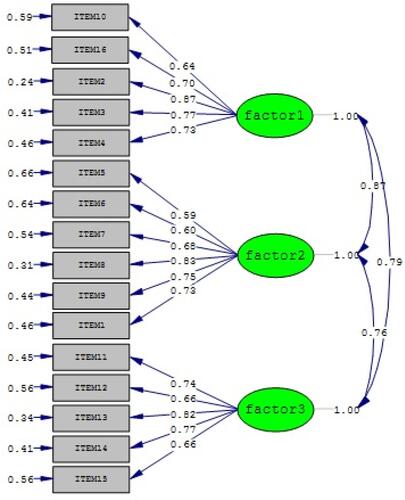
Table 2 Symmetry Measure of the Chinese Version PCSS
Figure 2 Individual agreement between test and retest scores of the Chinese version PCSS. The horizontal solid line represents the mean difference between both scores. The dashed line represents the linear regression line through the data points. The outer dashed lines represent the 95% limits of agreement (mean difference±1.96 SD of the difference).
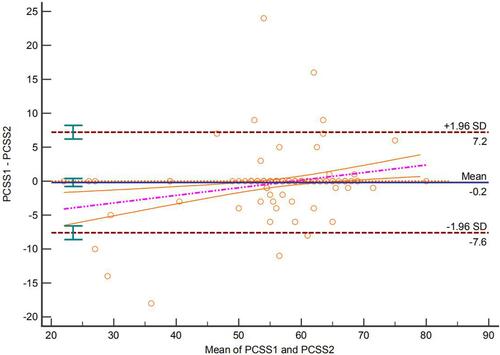
Table 3 The Main Variables and Assignments
Figure 3 Bayesian networks: model summary.
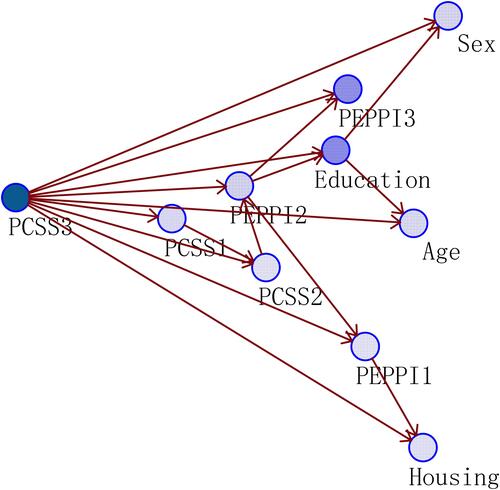
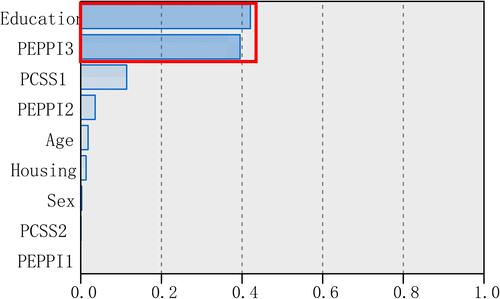
Figure 4 Bayesian networks: predictor importance. Important predictors in the red box.