Figures & data
Figure 1 Study selection flow chart.
Abbreviations: PRISMA, Preferred Reporting Items for Systematic Reviews and Meta-Analyses; SLR, systematic literature review.
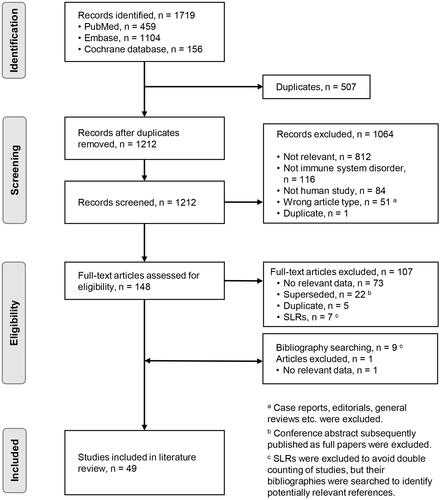
Table 1 Summary of Included Studies Comparing IV Infusion to SC Infusion
Figure 2 Summary of patient preferences for (A) IVIg or SCIg and (B) IV infusion or SC injection of non-immunoglobulin therapies. Data are patients’ expressed preferences or actual treatment choices (shown in italics). Eight studies in which percentage preferences were not reported were excluded.Citation25–Citation28,Citation48–Citation50,Citation58 In some studies not all patients expressed a preference, or preferences were not reported for one alternative; therefore, not all lines add up to 100%.
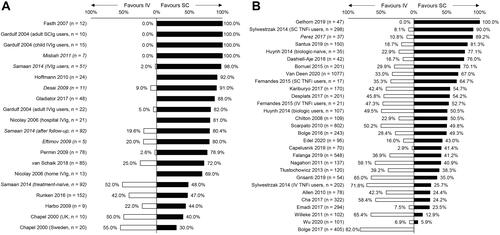
Table 2 Summary of Included Studies Comparing IV Administration to SC Injection
Table 3 Reported Reasons for Preferences
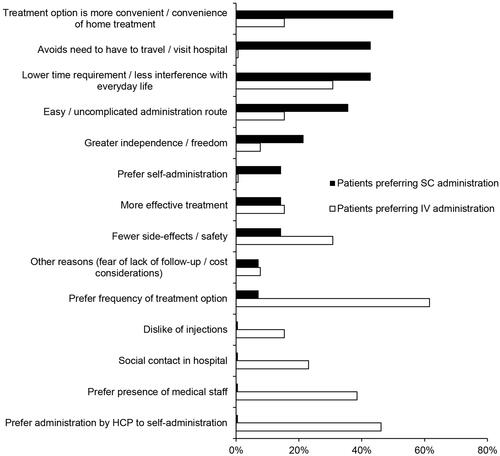
Figure 3 Summary of reported reasons for preferring SC or IV administration. Data are the proportion of studies reporting preferences for SC or IV administration (n = 14 and n = 13, respectively) in which each category was mentioned as a main driver of preferences or reported by ≥ 20% of patients.