
Figures & data
Table 1 Mean and 95% Confidence Intervals (CI) for Utility and Visual Analogue Scale (VAS) Results
Figure 1 Mean and 95% confidence intervals (CI) for (A) utility and (B) visual analogue scale (VAS) results.
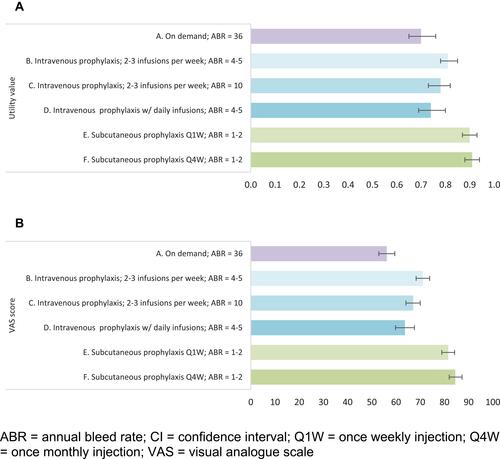
Table 2 Regression Coefficients in Random-Intercept Analysis of Utilities and Visual Analogue Scale (VAS) Results
Table 3 Regression Coefficients in Random-Intercept Analysis of Utilities on the Frequency of Injections/Infusions