
Figures & data
Table 1 Clinical Characteristics of the Participants
Table 2 Paired Analysis of Differences Between the First and the Second Survey in Group A Patients (Hyperthyroid at the First Survey and Euthyroid at the Second Survey)
Table 3 Single Regression Analysis of Survey Items Using Serum Level of FT3 as an Independent Variable
Figure 1 Linear fit of prices willing to pay for reducing CVD risk (Q11) according to serum level of FT3. Of the 140 returned survey forms from a cumulative total of 184 surveys given to 119 patients, 7 surveys in 6 patients did not have answers for Q11. A total of 133 answers in 113 patients were analyzed. Price willing to pay (¥/month) = 4219 + 741 × FT3 (pg/mL), R2 = 0.0580. Analysis of variance; degree of freedom = 1, sum of square = 1,000,897,112, F Ratio = 8.06, p = 0.0052.
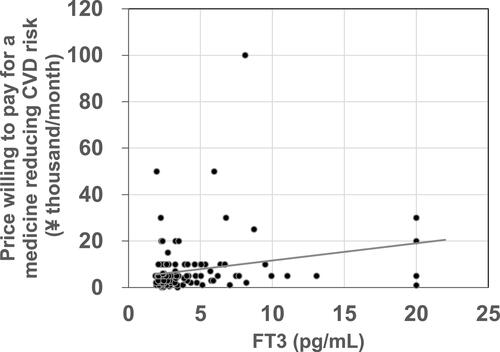
Figure 2 Linear fit of average out-of-pocket expenditure on medical care (Q9) according to serum level of FT3. Of the 140 returned survey forms from a cumulative total 184 surveys given to 119 patients, Q9 was not answered in two surveys. A total of 138 answers in 117 patients were analyzed. Out-of-pocket expenditure (¥/month) = 5599 + 385 × FT3 (pg/mL), R2 = 0.0508. Analysis of variance; degree of freedom = 1, sum of square = 273,587,993, F Ratio = 7.28, p = 0.0079.
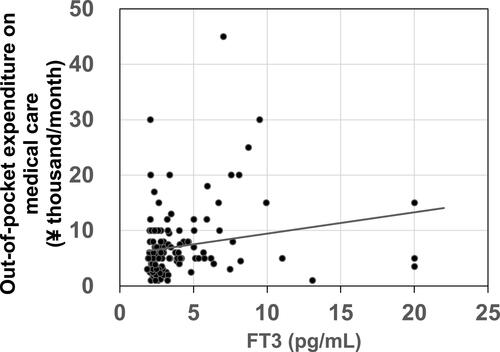
Figure 3 Linear fit of prices willing to pay for reducing CVD risk (Q11) according to average out-of-pocket expenditure on medical care (Q9). A total of 131 answers in 111 patients were analyzed. Price willing to pay (¥/month) = 3484 + 0.540 × out-of-pocket expenditure (¥/month), R2 = 0.0840. Analysis of variance; degree of freedom = 1, sum of square = 1,448,079,694, F Ratio = 11.84, p = 0.0008.
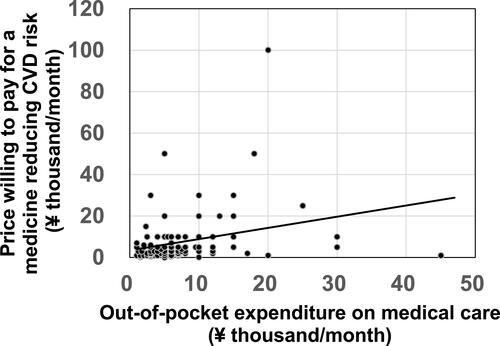
Table 4 Multiple Regression Analysis of Factors Associated with Price Willingness-to-Pay for a Medicine Reducing CVD Risk (WTPcvr) (Q11)