
Figures & data
Figure 1 Flowchart of inclusion of hypertensive patients.
Notes: The patients hospitalized in Xi’an People’s Hospital (Xi’an Fourth Hospital) between January and May 2021 were selected according to the inclusion criteria. Four hundred and eighty-seven hypertensive patients were randomly selected, of which 11 patients cannot be contacted and 23 patients did not want to participate. Finally, 453 hypertensive patients were recruited.
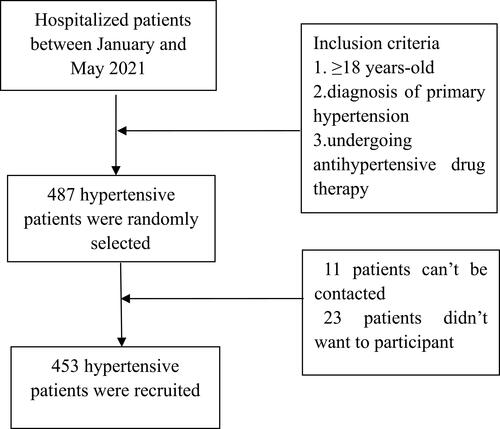
Table 1 Sociodemographic and Clinical Characteristics of Hypertension Patients (n=453)
Table 2 Factors Associated with Optimal Adherence (n=453)
Table 3 Binary Logistic Regression Analysis of Factors Associated with Adherence in Hypertensive Patients
Table 4 Scale Average Scores of Participants
Table 5 Spearman Correlation Analysis Among the HBTS and CFSS and Their Subgroups