
Figures & data
Table 1 Demographic and Clinical Characteristics for the Overall Study Population and for the 4 Groups with Different Cumulative Glycaemic Exposures
Table 2 HbA1c Value and Number of Measurements for the Overall Study Population and for the 4 Groups with Different Cumulative Glycaemic Exposures
Figure 1 Four HbA1c trajectories during the median of 2 years follow up in 4690 subjects with non-newly diagnosed Type 2 diabetes. Blue curve: group 1 with stable good glycaemic control; violet curve: group 2 with relative good glycaemic control; green curve: group 3 with moderate glycaemic control; red curve: group 4 with continuously poor glycaemic control.
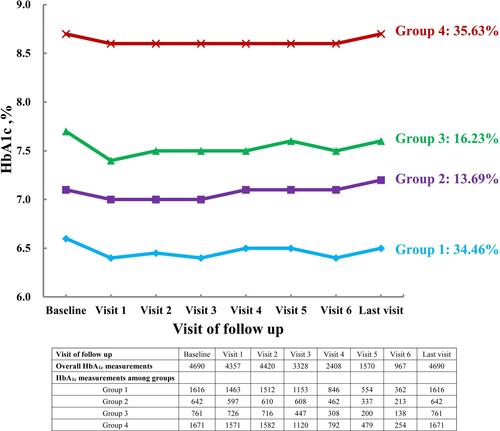
Table 3 Multinomial Logistic Regression Analysis Results for the 3 Groups with Less Good HbA1c Control