
Figures & data
Table 1 Demographic Characteristics of the Participants (N=518, N1=259, N2=259)
Table 2 Item Analysis and Factor Loadings for the SCN-TB
Figure 1 Scree plot of principal component factor analysis (N1=259).
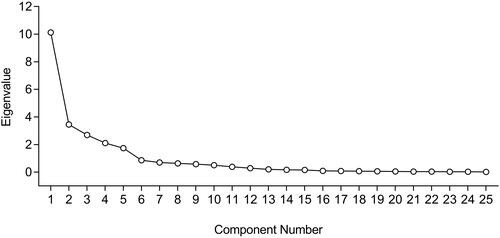
Figure 2 The bootstrapped standardized path diagram of the CFA model (N2=259).
Notes: q1 to q25 represent the items of the SCN-PTB, Factor 1: Physical needs, Factor 2: Psycho-emotional needs, Factor 3: Informational needs, Factor 4: Social needs, Factor 5: Practical needs; e: measurement error.
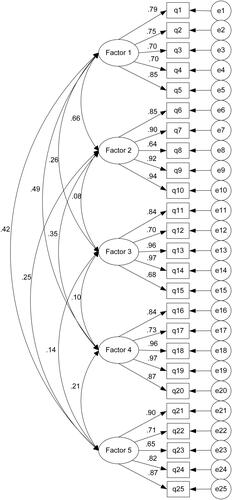
Table 3 Results of Convergent and Discriminant Validity Analysis
Table 4 Reliability of the SCN-TB