Figures & data
Table 1 The Main Variables and Assignments
Table 2 Sample Characteristics (N=110)
Figure 1 Patients’ EE score distribution. Mean=15.25, standard deviation (line)=4.6, N=110.
Abbreviation: EE, exercise anticipation.
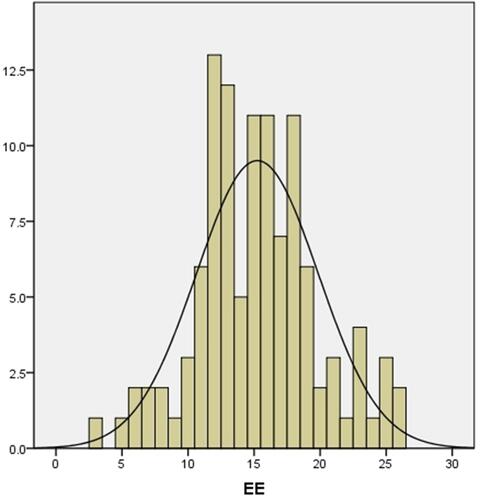
Table 3 Spearman Correlations Between Exercise Anticipation and Other Scales
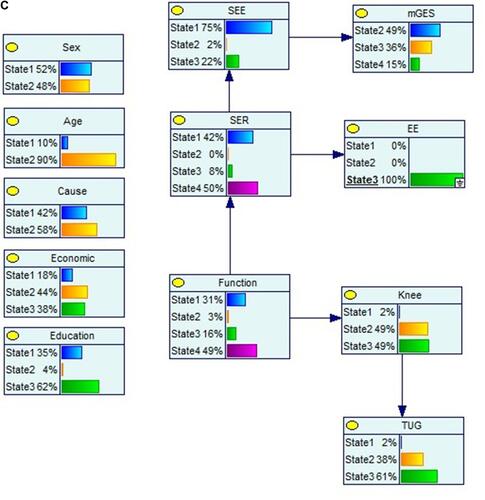
Figure 2 The Bayesian networks of exercise anticipation (EE).
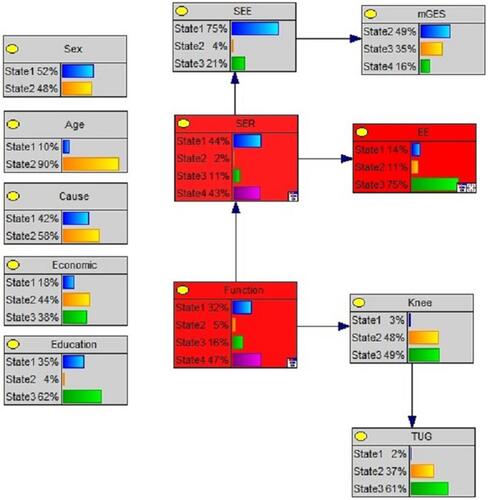
Figure 3 (A) Continued.
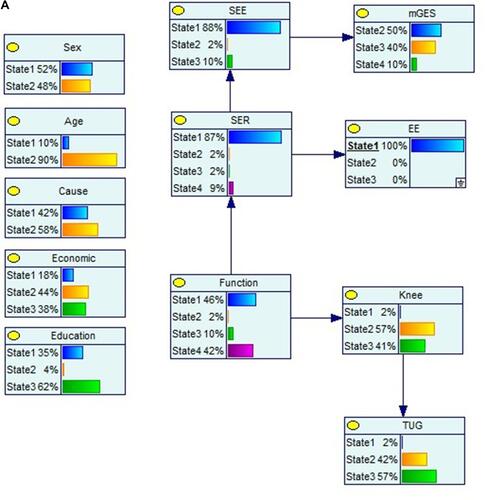
Figure 3 (B) Continued.
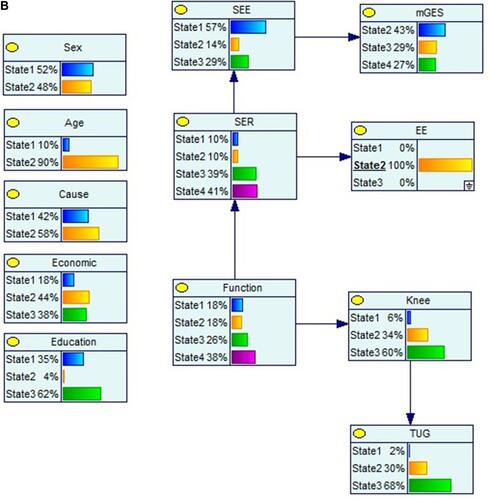
Figure 3 (A) Causal reasoning in Bayesian networks. (B) Causal reasoning in Bayesian networks. (C) Causal reasoning in Bayesian networks.