Figures & data
Table 1 Sociodemographic and Disease Characteristics for Respondents at Baseline and Follow-Up
Figure 1 Study population flowchart.
Abbreviations: DRV/c/FTC/TAF, darunavir/cobicistat/emtricitabine/tenofovir alafenamide; ART, antiretroviral therapy; HIV, human immunodeficiency virus.
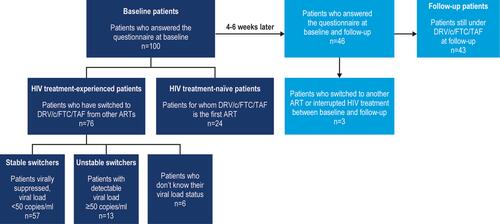
Table 2 HIVTSQs Total and Individual Item Scores at Baseline and Follow-Up
Figure 2 Percentage of respondents satisfied (HIVTSQs) at baseline.a
Note: aHIVTSQs individual item names abbreviated as in prior studies.Citation13.
Abbreviation: HIVTSQs, HIV Treatment Satisfaction Questionnaire status version.
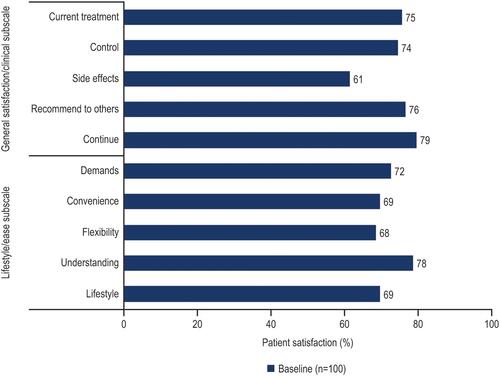
Figure 3 Percentage of respondents satisfied (HIVTSQs) among those who completed questionnaires at both baseline and follow-up.a
Note: aHIVTSQs individual item names abbreviated as in prior studies.Citation13.
Abbreviation: HIVTSQs, HIV Treatment Satisfaction Questionnaire status version.
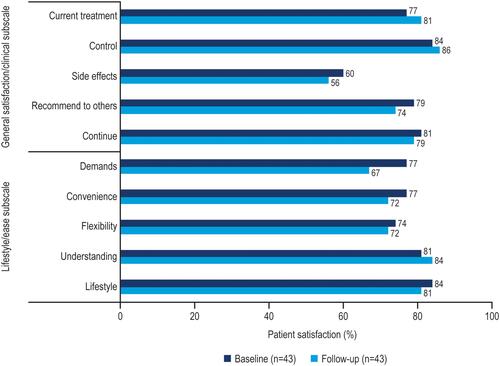
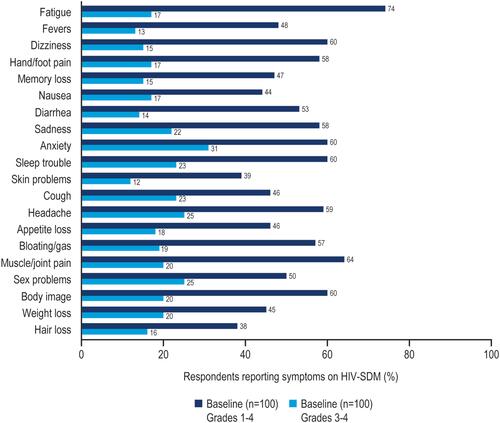
Figure 4 Percentage of respondents with overall symptoms (grades 1–4) or bothersome symptoms (grades 3–4) on HIV-SDM at baseline.a
Note: aHIV-SDM item names abbreviated as in prior studies.Citation14.
Abbreviation: HIV-SDM, HIV Symptom Distress Module.