Figures & data
Table 1 Demographics of Study Population (N=220)
Table 2 Responses of the Survey (N=220)
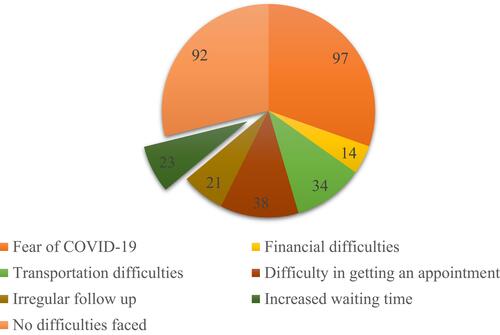
Figure 1 Responses from patients who chose in-person consultation (n=135), *Question only asked to the in-person group.
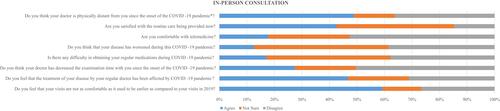
Figure 2 Responses from patients who chose telemedicine consultation (n = 85), **Question only asked to the telemedicine group.
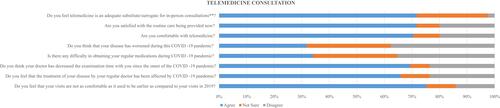
Table 3 Correlations Between Patients That Opted for an in-Person Consultation Since the COVID-19 Pandemic (N=135)
Table 4 Correlations Between Patients That Used Telemedicine for Consultation During the COVID-19 Pandemic (N=85)
Figure 3 Responses to Q6: What are the difficulties in consulting your doctor since the onset of the COVID-19 pandemic? (N=220).