
Figures & data
Table 1 Demographic Characteristics for the Study Participants
Figure 1 Perception about the seriousness of COVID-19 situation.
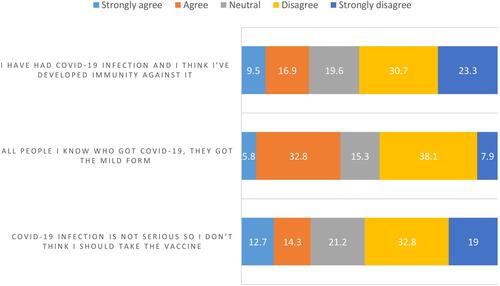
Figure 2 Reasons for hesitancy from receiving COVID-19 vaccine.
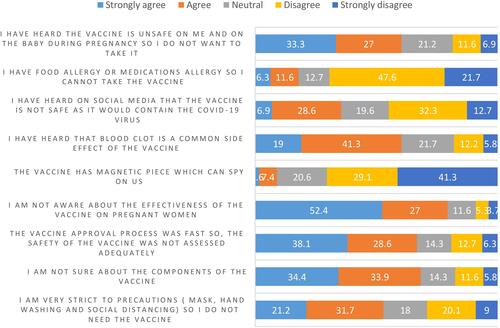
Figure 3 Perceived benefit from receiving COVID-19 vaccine.
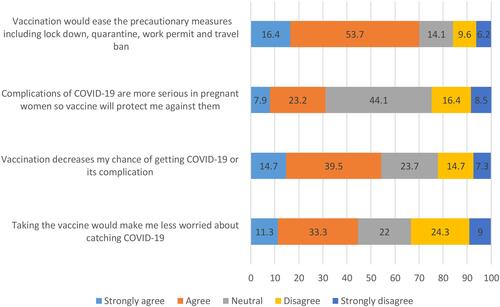
Figure 4 Causes of action and motivation to receive COVID-19 vaccine.
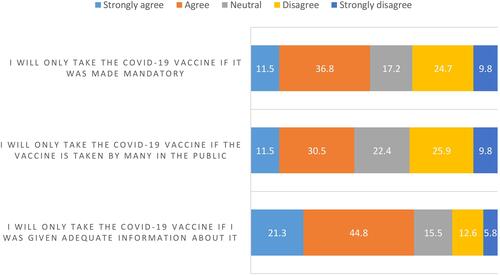
Table 2 Mean Vaccination Perception, Hesitancy, Perceived Benefit, and Cause of Action Score for All Participants (N= 378)
Table 3 Mean Vaccination Perception, Hesitancy, Perceived Benefit and Cause of Action Score Stratified by Demographic Characteristics for Women Who are Pregnant or Planning to Be (N= 189)