Figures & data
Table 1 Socio-Demographic Characteristics of All Cases and Responses to Covid-19 Related Questions (n = 449)
Table 2 The Mean Subscales and Total Quality of Life Scores (n = 449)
Table 3 Correlation Between Age, Time Elapsed from Diagnosis, Subscale Scores and Total Quality of Life Index (n=449)
Table 4 Mean Difference Between QOL Scales and Socio-Demographic Characteristics and COVID-19 Related Questions (n = 449)
Figure 1 Clustered bar mean of QLI and other subscales with respect to time in months after COVID-19 diagnosis.
Abbreviations: HFSUBa, health and functioning subscale; SOCSUBb, social and economic subscale; PSPSUBc, psychological and spiritual subscale; FAMSUBd, family subscale; OLI, Quality of Life Index.
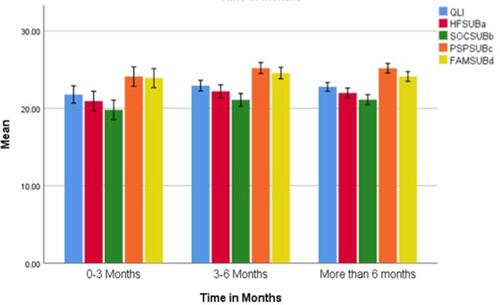
Figure 2 Clustered bar mean of QLI and other subscales according to history of chronic illness.
Abbreviations: HFSUBa, health and functioning subscale; SOCSUBb, social and economic subscale; PSPSUBc, psychological and spiritual subscale; FAMSUBd, family subscale; OLI, Quality of Life Index.
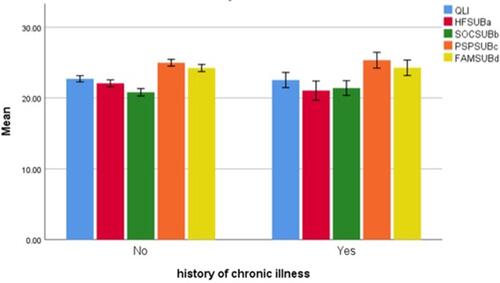
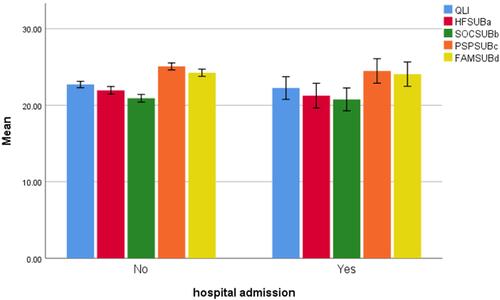
Figure 3 Clustered bar mean of QLI and other subscales according to history of hospital admission.
Abbreviations: HFSUBa, health and functioning subscale; SOCSUBb, social and economic subscale; PSPSUBc, psychological and spiritual subscale; FAMSUBd, family subscale; OLI, Quality of Life Index.