
Figures & data
Table 1 Demographic and Clinical Characteristics of Study Participants
Table 2 Internal Consistency of the Questionnaire
Table 3 Test vs Re-Test Results
Figure 1 Differences between initial assessment and re-test regarding the evaluated components.
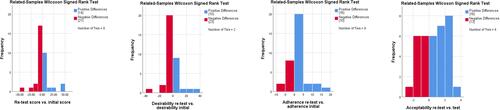
Figure 2 Correlation matrix between the initial assessment and re-test.
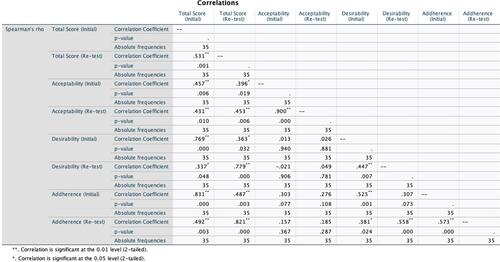
Figure 3 Correlations between test and re-test scores.
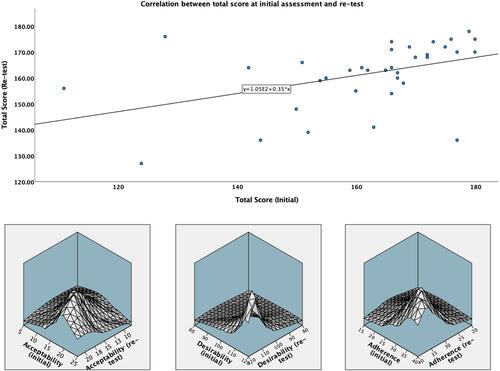
Figure 4 Correlations between total score and PHQ-9.

Figure 5 Correlations between total score and GAD-7.
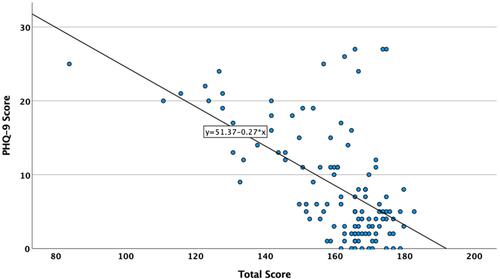
Table 4 Associations Between PHQ-9, GAD-7, and the Instrument Sub-Component Scores