
Figures & data
Figure 1 Flow chart for selection of study subjects.
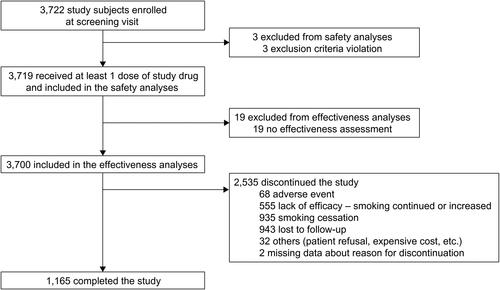
Table 1 Baseline Characteristics of Study Subjects
Table 2 Summary of Adverse Events with Occurrence in 5 Subjects or More
Table 3 Incidence of Adverse Events by Baseline Characteristics and Treatment Pattern
Table 4 Smoking Cessation Rate by Baseline Characteristics and Treatment Pattern
Figure 2 Seven-day point prevalence (PP) of smoking abstinence. Error bars indicate 95% confidence intervals. The 7-day PP of smoking cessation at weeks 1–2, 3–6, 7–10, and at or beyond week 11 were 51.7% (387/749), 59.6% (1740/2922), 73.3% (1114/1520), and 77.0% (1116/1449), respectively (p for trend = 0.023). Using the total study subject number of 3700 as the denominator, the 7-day PP of smoking cessation at the four visits was 10.5%, 47.0%, 30.1%, and 30.2%, respectively (p for trend = 0.448).
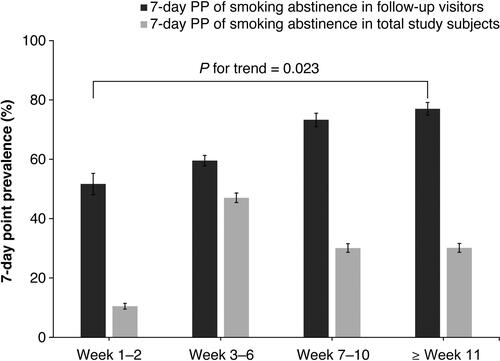
Table 5 Smoking Cessation and Continuation at Last Visit by Study Completion and Drop Out Reasons