Figures & data
Table 1 DLQI Scores According to Sociodemographic Characteristics and Clinical Characteristics
Table 2 DLQI Scores According to Adjusted Clinical Characteristics
Figure 1 Percentage of patients by DLQI items rated moderately or severely affected.
Abbreviation: DLQI, Dermatology Life Quality Index.
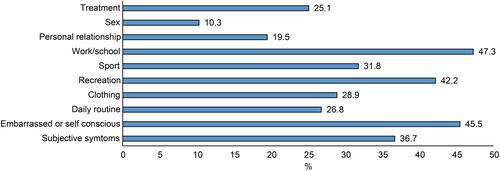
Table 3 Factors Independently Associating with DLQI Total Score
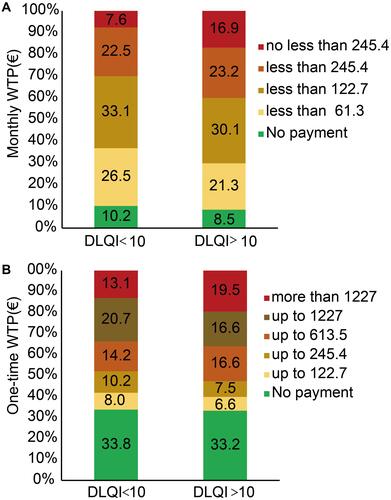
Figure 2 Monthly WTP (A) and one-time WTP (B) distribution in DLQI<10 and >10. The euro symbol (€) represents the euro currency.
Abbreviations: DLQI, Dermatology Life Quality Index; WTP, willingness to pay.