
Figures & data
Figure 1 Flow chart showing the study screening and enrolment process.
Abbreviations: KOA, knee osteoarthritis; TKA, total knee arthroplasty.
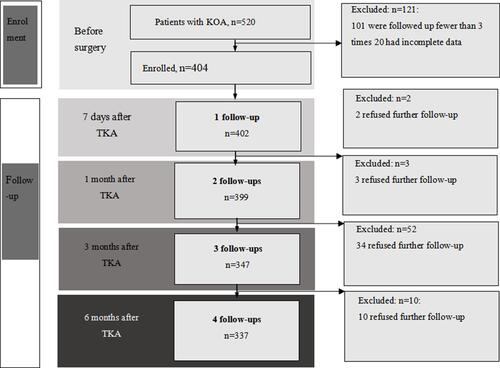
Table 1 Reliability of KOOS-PS and EQ-5D-5L Scores at Five Time Points from Before Surgery to 6 Months After Surgery
Table 2 Patients’ Demographic and Clinical Characteristics (n=404)
Table 3 EQ-5D-5L and KOOS-PS Mean Scores at Five Time Points from Before Surgery to 6 Months After Surgery
Figure 2 Average health-related quality of life trajectory based on the EQ-5D-5L score in a 2-class growth mixture model.
Abbreviations: EQ-5D-5L, European Quality of Life Five Dimension Five Level; TKA, total knee arthroplasty.
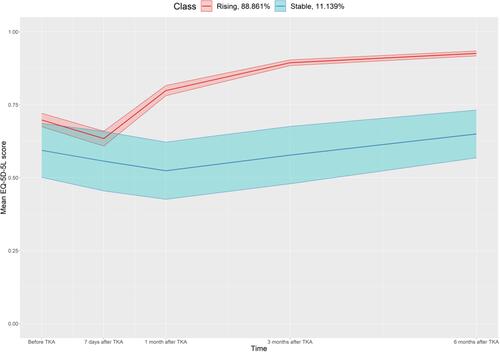
Table 4 Comparison of Sociodemographic Characteristics Between the Stable and Rising Groups
Table 5 Logistic Regression with EQ-5D-5L_C as the Dependent Variable