Figures & data
Table 1 Sociodemographic Characteristics and Clinical Data of the Patients Included in the Study (n=73)
Table 2 Percentage of Patients Who Reported Substantial Interference in Their Quality of Life According to the Responses “Quite a Few Problems” and “Many Problems” for Oral Function and General Activity (n=73)
Table 3 Percentage of Patients with Signs or Symptoms per Postoperative Day (n=73)
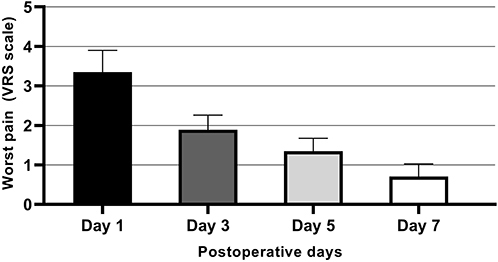
Figure 1 Mean and 95% Confidence Interval of the worst pain perceived according to the verbal rating scale (VRS) per postoperative day (n=73).