
Figures & data
Figure 1 Anti-hyperglycemic medication adherence profile after diagnosis. Patients were grouped based on whether or not taking anti-hyperglycemic medication and adherence levels by proportion of days covered (PDC) categories (adherent: PDC≥0.8, non-adherent: PDC <0.8). The percentage of patients taking anti-hyperglycemic medication and the average PDC score were summarized for each year from diagnosis (Year 1) to Year 16.
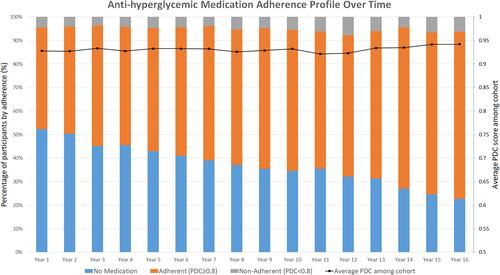
Table 1 Rate of Healthcare Utilization in the Subsequent 12 Months by Anti-Hyperglycemic Medication Status (n=2155)†
Table 2 Association Between Anti-Hyperglycemic Medication, Drug Adherence and Healthcare Utilization in the Subsequent 12 Months in Patients with Diabetes: Results from Multivariable Negative Binomial Regression Analysis*
Table 3 Past 12 Months Drug Adherence and Healthcare Utilization in the Subsequent 12, 36 and 60 Months: Sub-Group Analysis of Patients with at Least 72 Months of Follow-Up*