
Figures & data
Table 1 Sociodemographic Characteristics of the Study Participants (N = 1032)
Table 2 Participants Awareness About Home Delivery of Medication Service, and Their Support to This Service (N = 1032)
Figure 1 Participants perception towards the difference between home delivery of medication service and in-store refill of medications (n = 1032). OTC: over the counter.
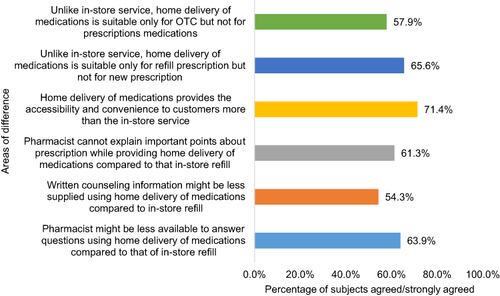
Table 3 Participants’ Perceptions Toward the Pros of Using Home Delivery of Medication Services as Compared Between Those with Chronic Diseases (N = 206) and Those Without (N = 826)
Table 4 Participants’ Perceptions Toward the Cons of Using Home Delivery of Medication Services as Compared Between Those with Chronic Diseases (N = 206) and Those Without (N = 826)
Table 5 Assessment of Factors Associated with the Use of Home Delivery of Medications Service (N = 1032)