
Figures & data
Table 1 Different Categories of Intervention Included in This Review, Which Were Formed by Using a Deductive-Inductive Content Analysis
Table 2 Search Terms
Figure 1 PRISMA 2020 flow diagram (A “study” includes a defined group of participants and one or more interventions and outcomes and might have multiple “reports”, that can be any document providing information).
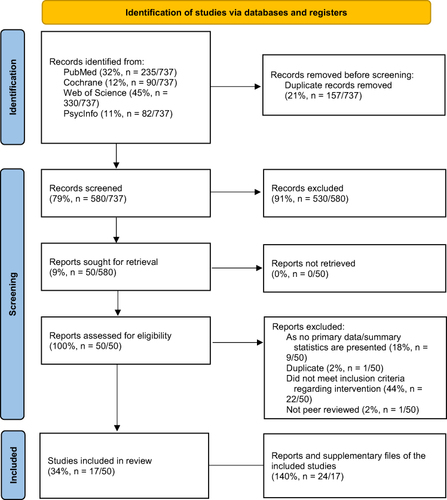
Table 3 Results of the Data Extraction
Table 4 Detailed Description of the Interventions of the Studies Included in This Review
Figure 2 Effects on medication adherence reported in the included studies in relation to different types of intervention (n=17).
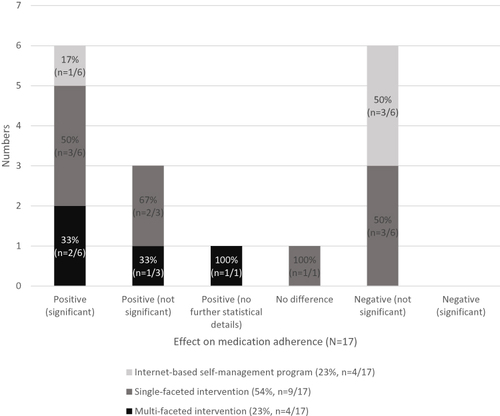
Figure 3 Effects on medication adherence reported by the included studies subdivided by interventions with and without personal contact including (n=17).
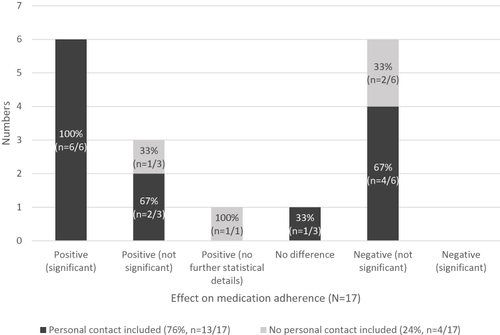
Table 5 Results of the Risk of Bias Analysis of Randomized Interventional Studies (RCTs) According to the RoB 2 Tool
Table 6 Results of the Risk of Bias Analysis of Non-Randomized Interventional Studies According to the ROBINS 1 Tool