Figures & data
Table 1 Patient Demographic Details
Table 2 Caregiver Demographic Details
Table 3 Mode of Treatment
Figure 1 Patient health status according to EQ-5D-5L. (A) EQ-5D-5L responses and overall health score. (Q1, Q2, Q3, Q4, Q5). (B) EQ-5D-5L responses and overall health score for non-severe and severe patients. (Q1, Q2, Q3, Q4, Q5). (C) Overall EQ VAS response. Whiskers represent minimum and maximum values (Range 61–80). (Q6). Base: All patients completing the survey themselves (n=46). EQ-5D-5L: EuroQol-5 Dimension. EQ VAS: EuroQol-visual analogue scales. Data represent percentage (%) of patients completing survey themselves. Please refer to the supplementary materials, for the questionnaires.
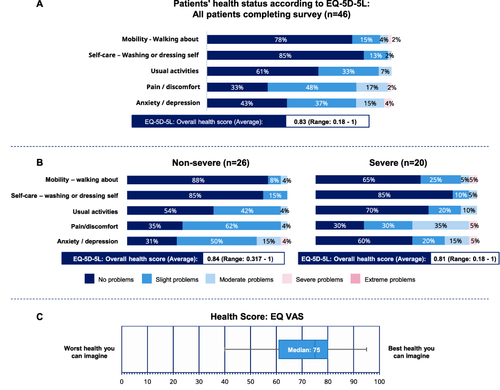
Figure 2 Patient treatment satisfaction. (A) Percentage of participants satisfied with N8-GP and previous treatments measured on a 7-point scale (Q36). Patients rating 5 to 7 were considered satisfied with the treatment and are represented as combined percentage of patients satisfied with N8-GP. Patients satisfied with N8-GP, n=59, 95%; patients satisfied with previous treatment: n=26, 42%. Base: All patients (n=62). (B) All reasons and main reasons for satisfaction with N8-GP (Q37). Base: All patients who are satisfied (n=59). (C) Main reasons for satisfaction for non-severe and severe patients (Q37). Non-severe: Less frequent injections (n=22, 61%) and improved QoL (n=29, 81%). Severe: Less frequent injections (n=20, 87%) and improved QoL (n=13, 57%). Base: Non-severe patients (n=37), all severe patients (n=25). Tx: Treatment. (D) Main reasons for satisfaction for patients on PPX and on-demand (Q37). Base: PPX (n=47), on-demand (n=15). PPX: Prophylaxis. †Indicate values are rounded.
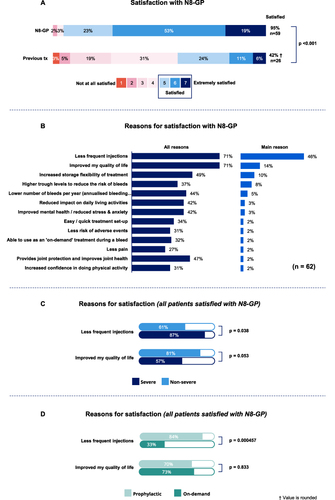
Figure 3 Preference for N8-GP over previous treatments. (A) Preference for N8-GP over previous treatments (n=53, 91%). (Patients rating 4 or 5 on a 5-point scale; Q38a). (B) Main unprompted reasons for preferring N8-GP (Q38b). Net indicates combined scores for parameters falling within main reasons. Base: patients who preferred N8-GP to previous treatments (n=53) (Please refer to Appendix 1 for examples of data analysis). (C) Preference for N8-GP for patient subgroups: Non-severe (n=29, 88%) and severe (n=24, 96%); prophylaxis (n=41, 93%) and on-demand (n=12, 86%). (Please refer to supplementary materials for examples of data analysis). Tx: Treatment. Base: All patients with a previous treatment (n=58).
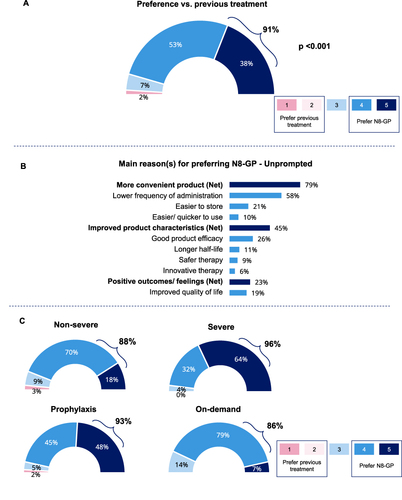
Table 4 Impact of Hemophilia on Day-to-Day Life
Figure 4 Impact of N8-GP treatment on QoL and QoL score. (A) Agreement with statements for overall QoL (n=52, 84%), daily living (n=51, 82%) and joint protection and stable joint health (n=40, 65%), rated on a scale from 1 to 5 with 4 or 5 rating considered as agreement to the statements. Percentages are combined from 4 and 5 ratings. (Q39) (n=62). (B) QoL score currently and prior to N8-GP for all patients with 100 representing average person’s QoL score. (Q26 & Q35) (n=62).
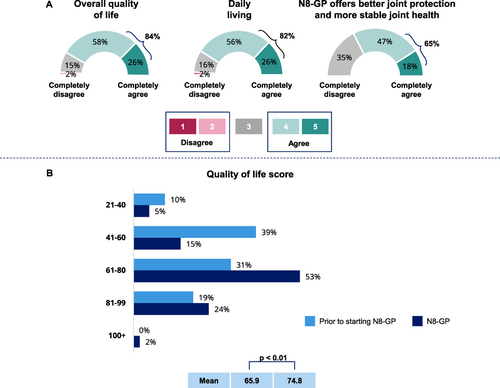
Figure 5 Performance of N8-GP compared to previous treatment. (A) Percentage of responses from non-severe (n=37) and severe (n=25) groups for performance of N8-GP compared to previous product. (B) Percentage of responses from prophylaxis (n=47) and on-demand (n=15) patient groups for performance of N8-GP compared to previous treatment. †Indicate values are rounded.
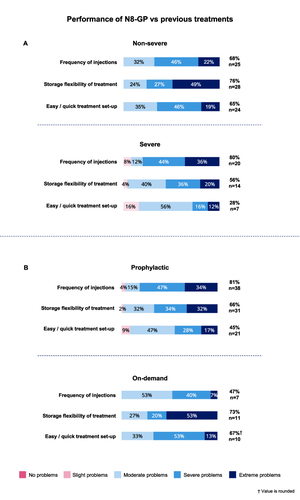
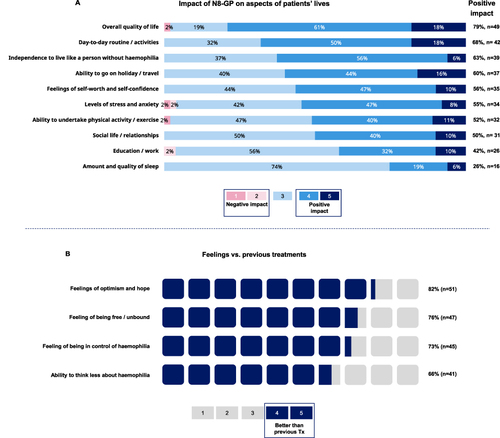
Figure 6 Long-term impact of N8-GP on patients’ lives. (A) Percentage of responses for various aspects of living. Base: n=62 (Q41). (B) Percentage of responses for aspects of feelings for N8-GP compared to previous treatments. Base: n=62 (Q44).