
Figures & data
Figure 1 The study protocol explains the process of the study and data collected at baseline and follow-up.
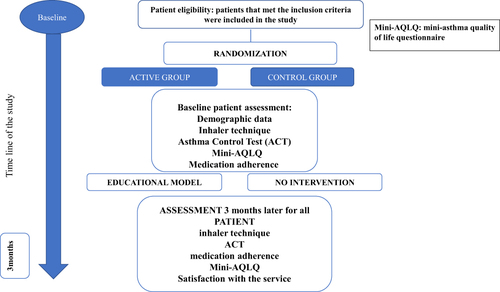
Figure 2 Inhaler technique education protocol.
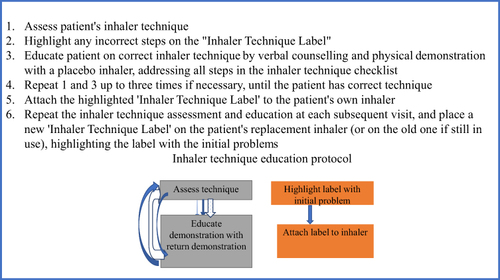
Table 1 Demographic Characteristics of the Study Sample (n = 157) for the Active (n = 79) and Control Groups (n = 78)
Figure 3 Study flow for the study sample (n = 157).
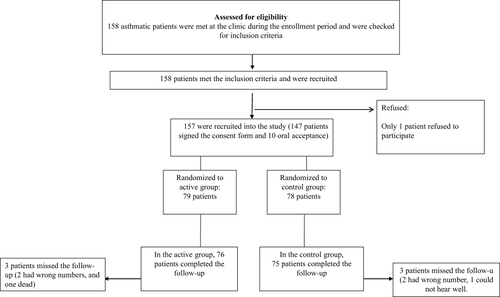
Table 2 Inhaler Technique Scores and Asthma Control Test (ACT) Scores Comparing Patients in the Active (n = 79) and Control Groups (n = 78) at Baseline and Active (n = 76) and Control (n = 75) at the Follow-Up
Figure 4 Active group (n = 79) inhaler technique score at baseline before training, baseline after training, and at follow-up (n = 76).
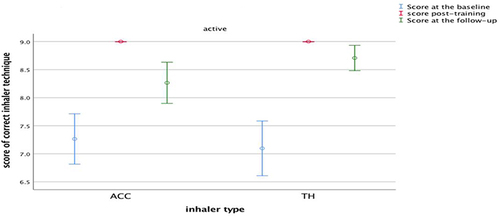
Figure 5 Inhaler technique scores for the control group (n = 78) at baseline before training, baseline after training, and at follow-up (n = 75).
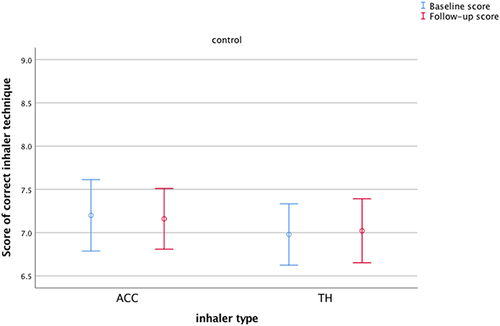
Table 3 Clinical Outputs for Adherence, Comparing Patients in the Active (n = 79) and Control Groups (n = 78) at Baseline, and Active (n = 76) and Control (n = 75) at the Follow-Up
Table 4 Clinical Outputs for AQLQ, Comparing Participants in the Active Group at the Baseline (n = 79) and Follow-Up (n = 76) at Baseline, and Control Group at the Baseline (n = 78) and at the Follow-Up (n = 75)