
Figures & data
Figure 1 Patients flow chart.
Abbreviations: Li-ESWT, low-intensity extracorporeal shock wave therapy; IIEF-EF, erectile function domain of International Index of Erectile Function questionnaire.
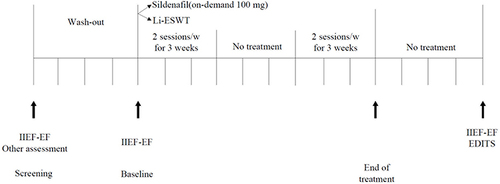
Table 1 Baseline Characteristics of Participants in Two Treatment Groups
Figure 2 Study and treatment flow chart.
Abbreviations: IIEF-EF, erectile function domain of International Index of Erectile Function questionnaire; Li-ESWT, low-intensity extracorporeal shock wave therapy; EDITS, Erectile Dysfunction Inventory of Treatment Satisfaction questionnaire.
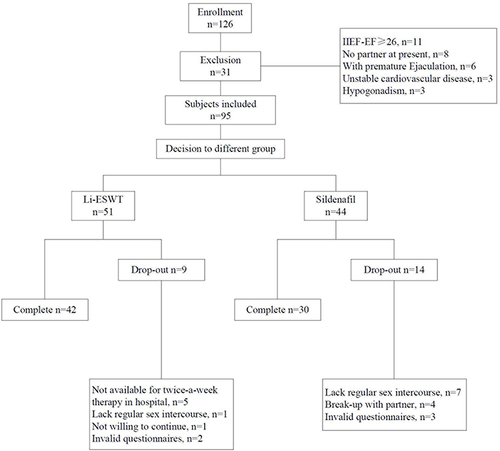
Table 2 The Total EDITS Scores and Total EDITS Index Scores at the First-Month Follow-Up After Treatment by Adjustment†
Table 3 Comparison of Patients and Female Partners’ Degree of Treatment Satisfaction Assessed by EDITS by Adjustment†