Figures & data
Figure 1 Results of the search and screening process.
Notes: PRISMA figure adapted from Liberati A, Altman D, Tetzlaff J et al. The PRISMA statement for systematic review and meta-analysis of studies that evaluate health care intervention: explanation and elaboration. Journal of Clinical Epidemiology. 2009; 62(10). Creative Commons.Citation21
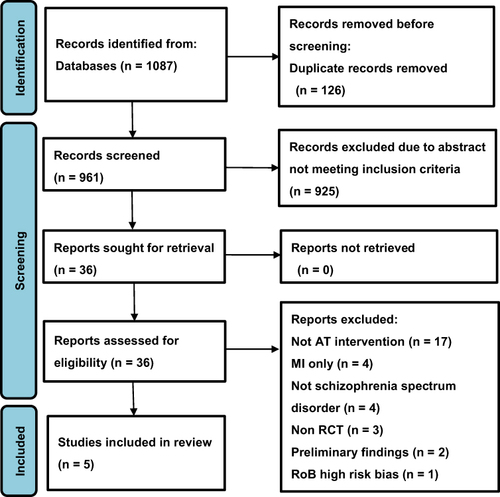
Figure 2 Risk of bias in each of the five studies.Citation17,Citation24–27
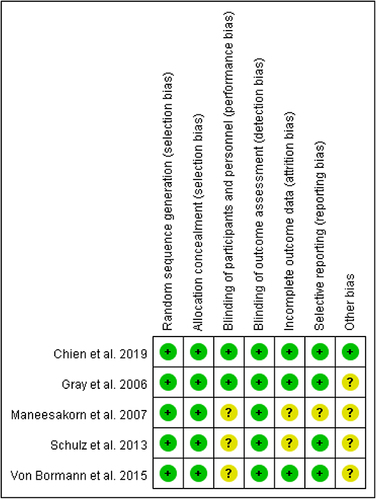
Figure 3 Overall risk assessment of the five studies.
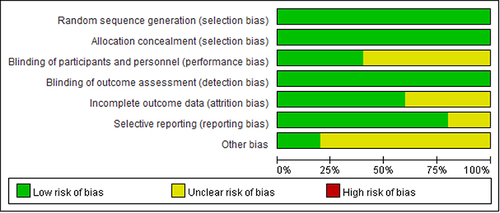
Table 1 Summary of the Five Selected Studies
Figure 4 The effects of AT and TAU on psychiatric symptoms.Citation17,Citation24–27
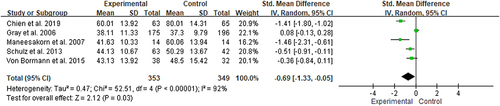
Figure 5 The effects of AT and TAU on medication adherence attitudes.Citation17,Citation24–27
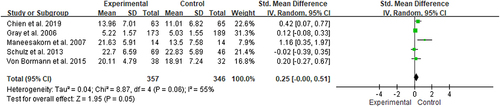
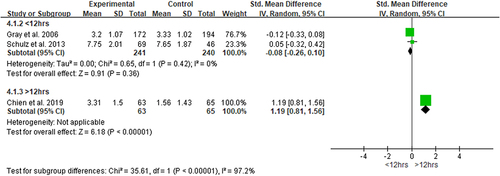
Figure 6 The effects of AT and TAU on medication adherence behaviors.Citation17,Citation24,Citation26
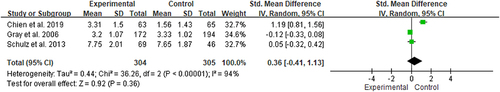
Figure 7 Subgroup analysis by intervention duration.Citation17,Citation24,Citation26