Figures & data
Table 1 Clinical Background and Demographics of Eligible Respondents at the Time of the Survey
Figure 1 Behavior changes in patients. Change in (A) Frequency of treatment visits to a medical institution in a month, (B) Rehabilitation (voluntary training) in a week, and (C) Going out in a week among patients from pre–COVID-19 pandemic (February 2020) to post–national state of emergency (August 2020) or to the time of the survey (February 2021).
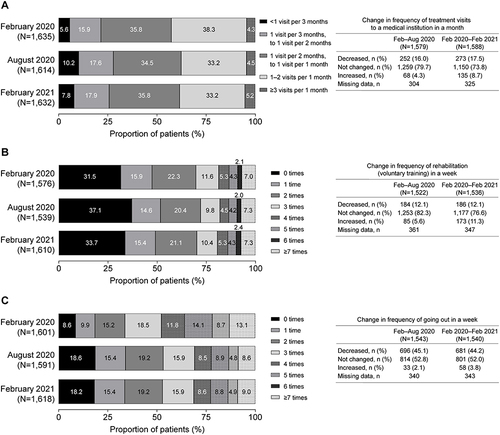
Figure 2 Differences between patients’ and caregivers’ perceptions of self-assessed symptom changes in Hoehn and Yahr scale. Differences from pre–COVID-19 pandemic (February 2020) to post–national state of emergency (August 2020) or to the time of the survey (February 2021). Patient perception: February 2020 to August 2020 (N=1435, missing data = 448); February 2020 to February 2021 (N=1437, missing data = 446). Caregiver perception: February 2020 to August 2020 (N=1051, missing data = 832); February 2020 to February 2021 (N=1051, missing data = 832).
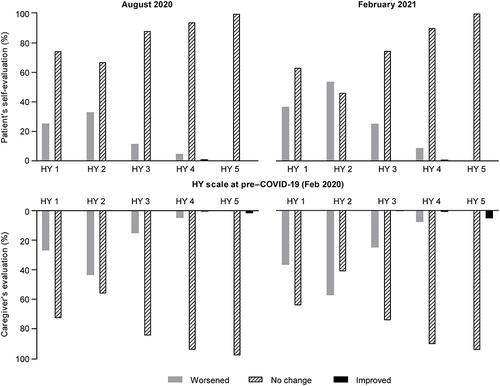
Table 2 Ordinal Logistic Regression Analysis of Change in Hoehn and Yahr Scale
Figure 3 Changes in self-assessed motor and nonmotor symptoms. Change in severity of (A) Motor and (B) Nonmotor symptoms in patients from pre–COVID-19 pandemic (February 2020) to post–national state of emergency (August 2020) or to the time of the survey (February 2021).
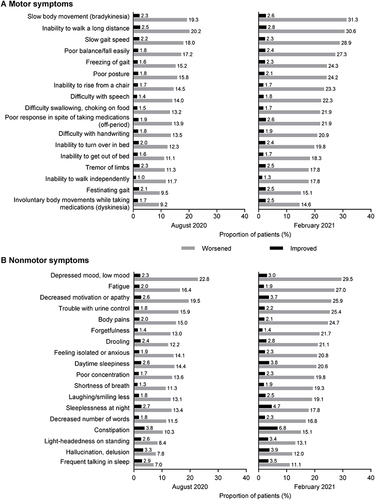
Table 3 Changes in Caregivers’ Health Status
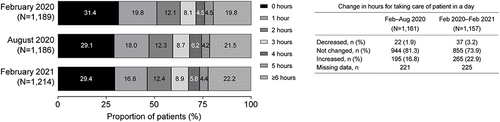
Figure 4 Changes in caregiver burden. Changes in daily caregiver hours from pre–COVID-19 pandemic (February 2020) to post–national state of emergency (August 2020) or to the time of the survey (February 2021).