
Figures & data
Table 1 Demographic Characteristics of the Study Sample
Table 2 Conditional Logit Model
Figure 1 Conditional logit model, β-coefficients and 95% confidence intervals.
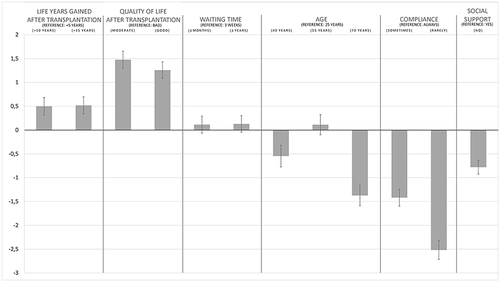
Figure 2 Latent class analysis, β-coefficients and 95% confidence intervals. Light: Class 1; Dark: Class 2.
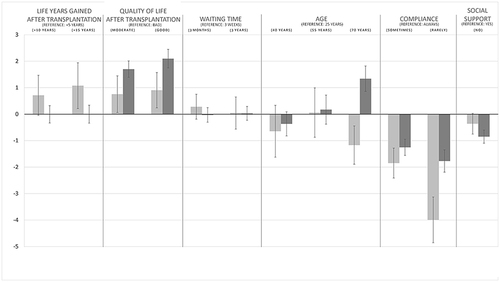
Table 3 Demographic Characteristics of the Identified Classes
Table 4 Importance Directly Attributed to the Attributes of the DCE