Figures & data
Figure 1 Study Flow Chart.
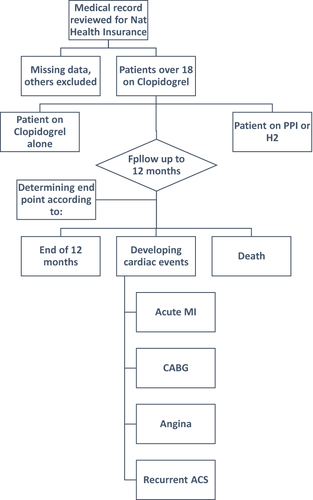
Table 1 The Characteristics of the Sample (N= 443)
Table 2 Association Between CV Events and Other Variables. (N=443)
Table 3 Association Between PPI Molecules and CV Events. (N=331)
Table 4 Association Between CV Events Comparing Interacting PPIs to Non-Interacting (N=443)
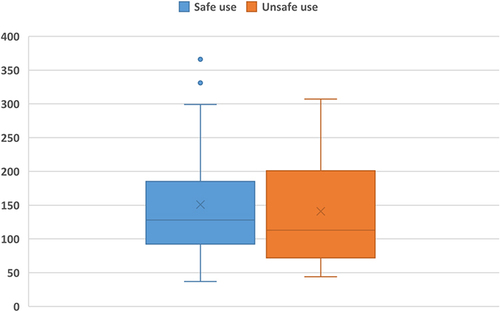
Figure 2 The median time to CV Events.