Figures & data
Figure 1 Conceptual framework of the study.
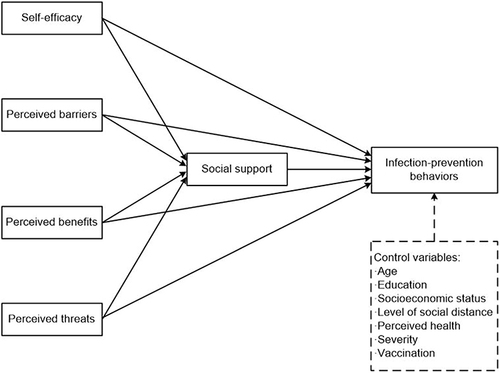
Table 1 Characteristics of the Participants and Infection-Prevention Behaviors (N=700)
Table 2 Descriptive Statistics of Observed Variables (N=700)
Table 3 Correlation Matrix of Observed Variables (N=700)
Table 4 Parameter Estimates for the Hypothetical Model and Standardized Direct, Indirect, and Total Effects After Controlling for Demographic Characteristics (N=700)
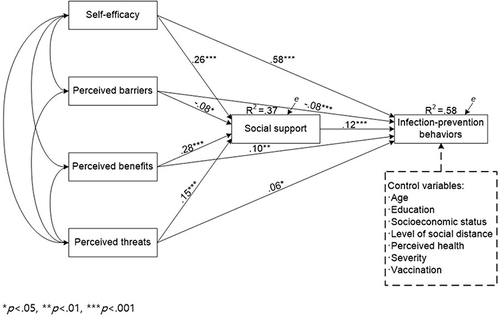
Figure 2 Path diagram for the hypothetical model. *p<0.05, ** p<0.01, *** p<0.001.