
Figures & data
Figure 1 PRISMA flow chart.
Notes: PRISMA figure adapted from Page MJ, McKenzie JE, Bossuyt PM, et al. The PRISMA 2020 statement: an updated guideline for reporting systematic reviews. BMJ. 2021;372:n71. Creative Commons.Citation16
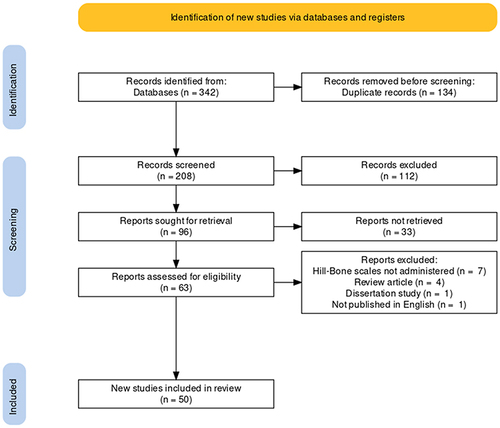
Table 1 General Characteristics of Included Studies (N=50)
Table 2 Randomized Controlled Trials Measuring Adherence in Hypertension (n=4) and Diabetes (n=2) Treatment