Figures & data
Table 1 Bivariate correlations between depression severity (HAMD-17, CGI-S) at baseline and quality of life (EQ-5D, EQ-VAS) at baseline and at the study endpoint
Figure 1 Influence of baseline PPS on endpoint EQ-VAS is consistent at different severity levels of the HAMD-17 score at baseline.
Abbreviations: PPS, painful physical symptoms; EQ-VAS, EuroQoL-Visual Analogue Scale; HAMD-17, Hamilton Rating Scale for Depression-17.
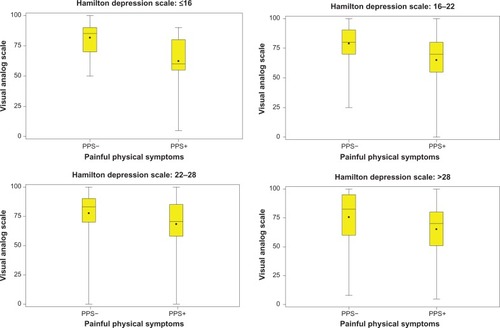
Figure 2 Influence of baseline PPS on endpoint EQ-5D score is consistent at different severity levels of the HAMD-17 score at baseline.
Abbreviations: PPS, painful physical symptoms; EQ-5D, EuroQoL-5 Dimension; HAMD-17, Hamilton Rating Scale for Depression-17.
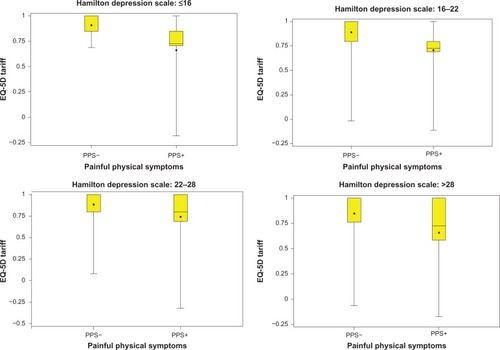
Table 2 Baseline variables associated with quality of life scores (EQ-5D and EQ-VAS) at 3 months (linear regression analysis)