Figures & data
Table 1 Description of the Hypothetical Profile of Patients on a Waiting List for Elective Procedures with Three Possible Degrees of Functional Severity (1-A Shows the Definition of Each Profile for Each Procedure and 1-b Shows a Summary of Defined Procedures, Profiles and Degrees)
Table 2 Description of Demographic Characteristics of the Study Population
Figure 1 Comparison between patients and professionals regarding prioritization results (most to least important) by type of surgical interventions (Score toward +1 indicated as highest priority and when score towards −1 indicated as lowest priority on waiting list).
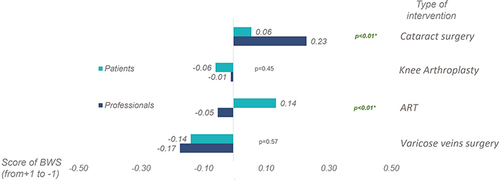
Figure 2 Comparison between patients and professionals regarding prioritization results (most to least important) by type of surgical interventions and by severity degrees (Score toward +1 indicated as highest priority and when score towards −1 indicated as lowest priority on waiting list).
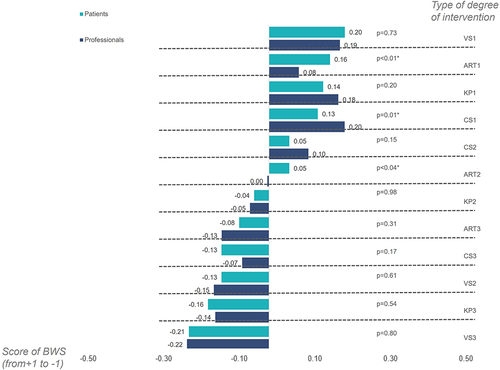
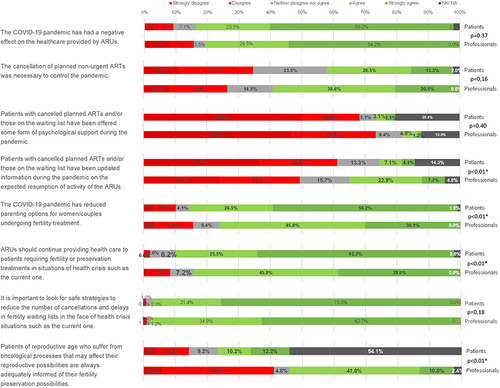
Figure 3 Answers to ad-hoc questionnaire by patients and professionals in arus on the impact of the pandemic on art service management (*p-value<0.05).