Figures & data
Table 1 Diabetes attributes and levels
Figure 1 Example choice question.
Abbreviation: CHF, congestive heart failure.
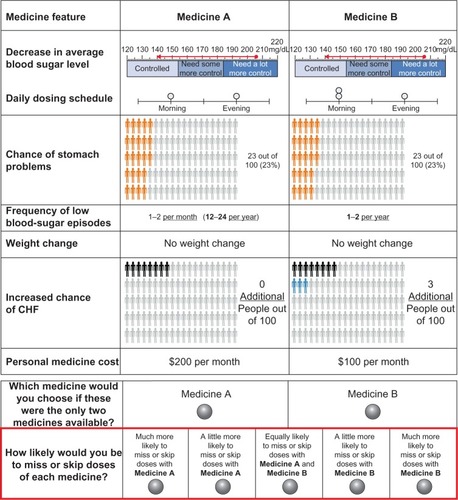
Table 2 Characteristics of the study sample
Figure 2 Preference weights (n = 1,114).a
Note:
aThe vertical bars denote the 95% confidence interval around the point estimate.
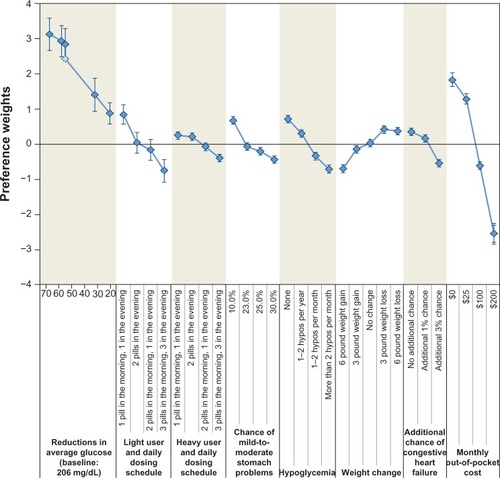
Table 3 Willingness to pay for improvements in daily dosing schedule (Us$/month)
Figure 3 Adherence weights (n = 524).a
Note:
aThe vertical bars denote the 95% confidence interval around the point estimate.
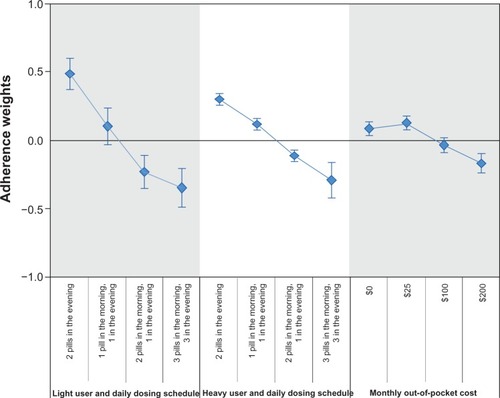
Table S1 Literature reviewed in determining attributes and levels