Figures & data
Table 1 Sociodemographic Characteristics of the Enrolled Participants (n=397)
Table 2 Patients’ Responses to Asthma, Flu, and Vaccine Knowledge Items (n=397)
Table 3 Participants’ Responses to Influenza Vaccine Attitude Items. (n=397)
Table 4 Patients’ Responses to Different Asthma Practice Items. (n=397)
Table 5 Patients’ Responses to Influenza Vaccine Practice Items (n=397)
Table 6 Multinomial Regression Model Between Different Sociodemographic Characteristics and the Intention to Vaccinate Against Flu This Year (n=397)
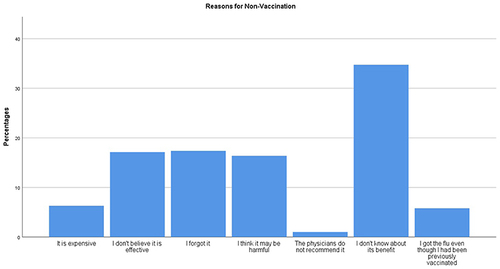
Figure 1 Reasons for non-vaccination.