
Figures & data
Figure 1 Overview of the conceptual framework model.
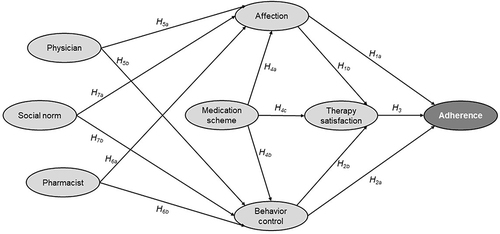
Table 1 Baseline Characteristics of the Study Sample Comparing A14-ScoringsCitation50
Figure 2 Adherence distribution of the sample according to the A14-scoring.Citation50
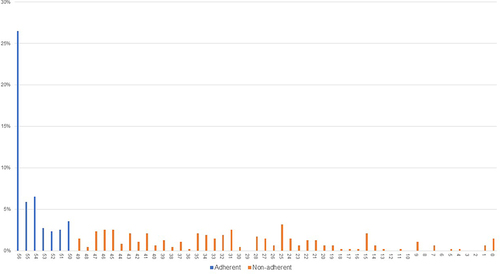
Table 2 Measurement Model Results
Figure 3 PLS path model and results.
Notes: We used a bootstrapping routineCitation22 with 10.000 subsamples, 476 observations per subsample, and a no sign change option to determine the significance of the path coefficients. ***p < 0.01.
Abbreviations: FDC, fixed-dose combination; MONO, monotherapy compound.
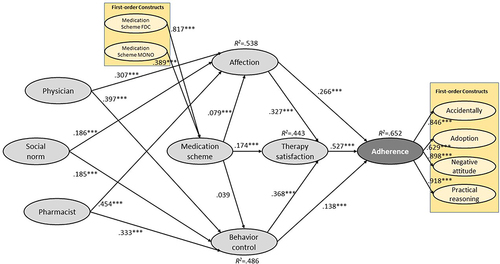
Table 3 Discriminant Validity: Fornell-Larcker Criterion and HTMT
Table 4 Measurement Model Results - Direct Effects
Table 5 Measurement Model Results – Mediation
Table 6 Measurement Model Results – Total Effects