Figures & data
Table 1 Distribution of Respondents According to Demographic Variables (n = 62) and Reliability Testing (n = 20)
Table 2 Translation and Cross-Cultural Adaptation of the Arabic Version of AxEL
Table 3 Results of the Reliability, Measurement Error, and Validity of the Translation Validation for AxEL
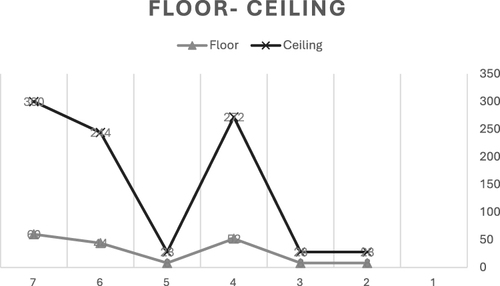
Figure 1 Floor and ceiling effects.