
Figures & data
Table 1 Inclusion and exclusion criteria
Figure 1 Psychosocial categories.
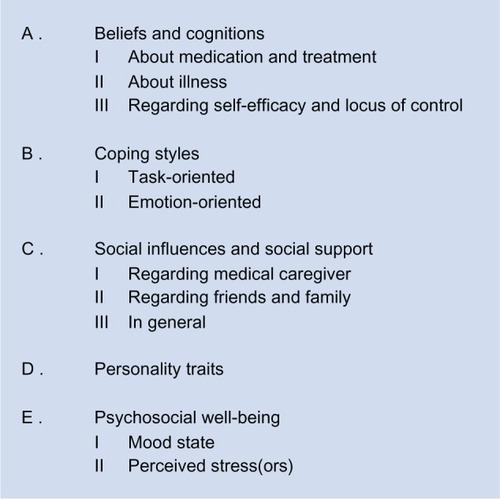
Figure 2 Flowchart of study inclusion process.
Abbreviation: CPMM, chronic preventive maintenance medication.
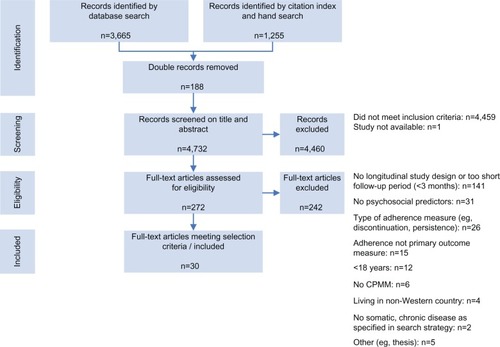
Table 2 Study characteristics and resultsTable Footnote*
Table 3 Level of evidence for longitudinal associations between psychosocial categories and medication non-adherence
Table S1 Framework for judging methodological quality
Table S2 explanation of measures and resultsTable Footnote*
Table S3 Results of judging methodologic quality
Table S4 Sensitivity analyses: methodological quality, disease, adherence measures, and statistical analyses