Figures & data
Table 1 Patient demographics and therapy characteristics
Figure 1 Changes in the treatment of patients included in the study.
Notes: Numbers within the rectangles indicate the number of patients receiving that anti-tumor necrosis factor therapy and the proportion of all patients at that treatment iteration. Numbers outside the rectangles show the number of patients changing to the next indicated treatment.
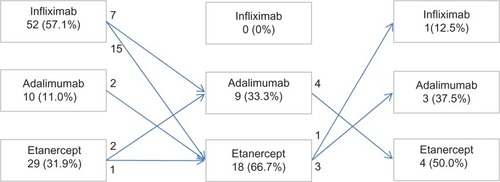
Figure 2 Drug survival probabilities for infliximab (n = 53), etanercept (n = 51), and adalimumab (n = 22) in the study population.
Abbreviation: n, number.
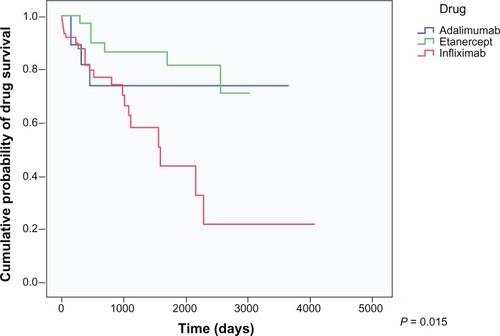
Figure 3 Drug survival probabilities for adalimumab, etanercept, and infliximab, naïve versus previous anti-TNF treatment.
Notes: (A) naïve patients (n = 86). (B) Patients who were previously treated with one or more anti-TNF agents (n = 40).
Abbreviations: n, number; TNF, tumor necrosis factor.
Abbreviations: n, number; TNF, tumor necrosis factor.
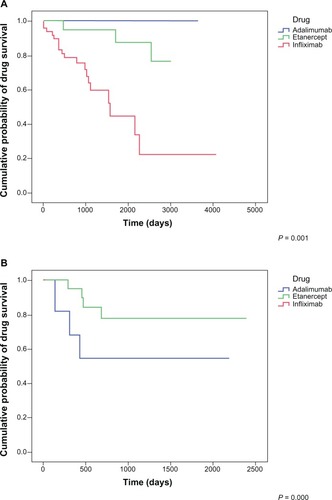
Figure 4 Drug survival probabilities for adalimumab, etanercept, and infliximab, by age group.
Notes: (A) Patients younger than 60 years of age (n = 74). (B) Patients who were 60 years of age or older (n = 52).
Abbreviation: n, number.
Abbreviation: n, number.
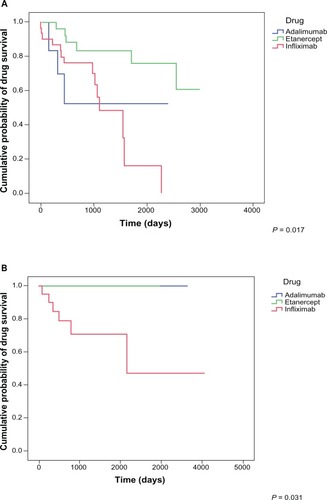
Table 2 Predictors of survival of anti-TNF therapy in RA patients