Figures & data
Table 1 Clinical and economic characteristics at baseline
Figure 1 Treatment persistence (A) and adherence (B) in the basal–bolus (GLA + RAI) and premix insulin (PMX) cohorts over 1-year of follow-up. In addition to the 90th percentile data, sensitivity analyses involving the 75th and 95th percentile are shown for persistence data.
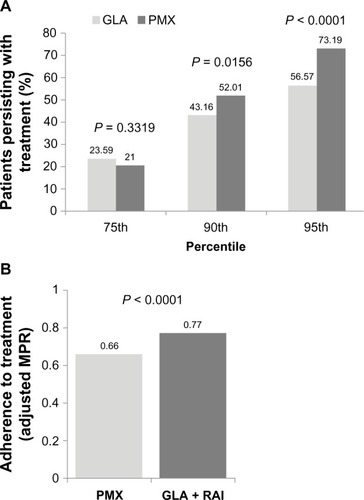
Figure 2 Kaplan–Meier curve for the time to treatment discontinuation.
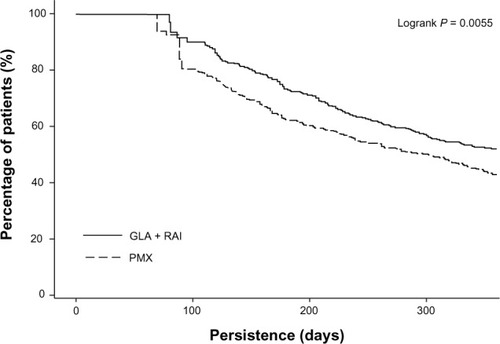
Figure 3 A1C reduction among patients in the basal–bolus (GLA + RAI, n = 207) and premixed insulin (PMX, n = 234) cohorts who had baseline and follow-up data available.
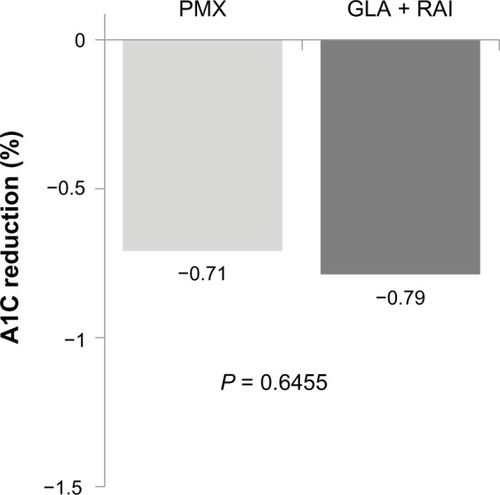
Figure 4 Hypoglycemia prevalence (A) and incidence (B) at the end of the 1-year follow-up.
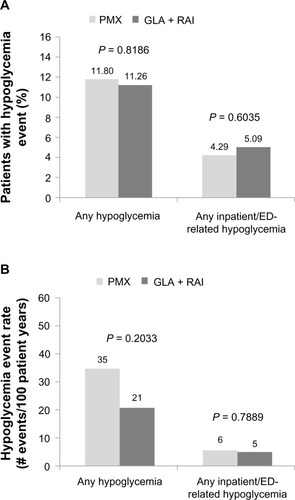
Figure 5 Health care cost outcomes over 1 year of follow-up.
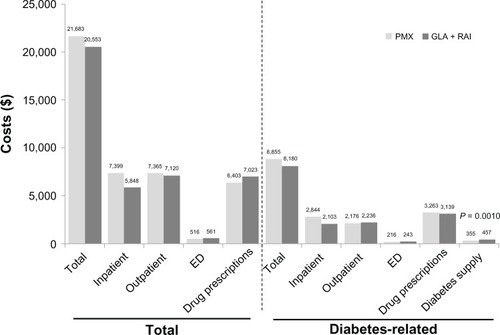
Table 2 Health care resource utilization over 1 year of follow-up