Figures & data
Figure 1 Flowchart of the study.
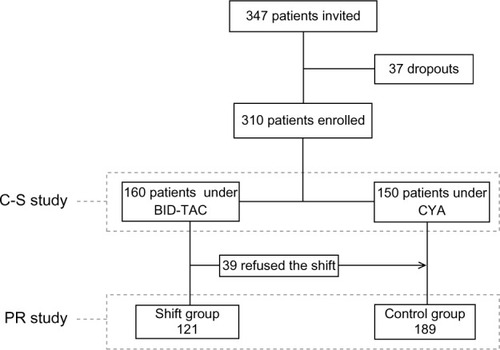
Table 1 Main data of the whole cohort of patients, and of adherent and nonadherent patients according to the ITAS score (≤10) at baseline
Table 2 Main significant differences in average scores of specific items of Life Satisfaction Index and Transplant Care Index between adherent and nonadherent patients
Table 3 Factors predictive of nonadherence at baseline in the whole cohort of patients (n=310)
Table 4 Basal data (T0) of the patients of the Shift and control groups
Figure 2 Prevalence of nonadherence in the two groups under study throughout the observation period, expressed as percentage value; the absolute number of patients is reported in columns (T0 = basal; T3 and T6 = after 3 and 6 months of follow-up, respectively).
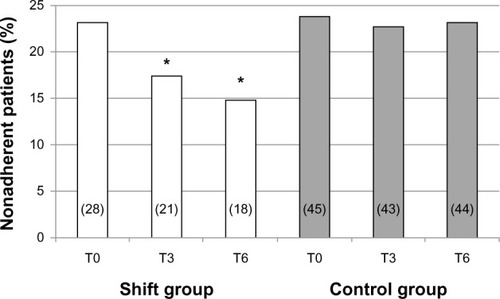
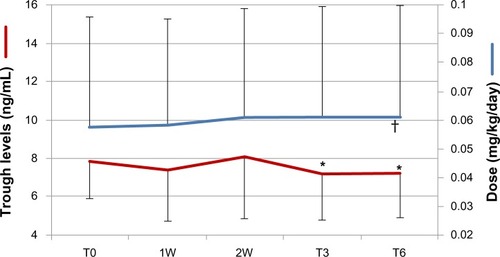
Figure 3 Doses (blue line) and trough levels (red line) of once-daily tacrolimus (D-TAC) throughout the observation period in patients of the Shift group. T0 represents the mean value of the last three bis in die TAC trough levels and doses before the shift; 1W and 2W represent the determinations of trough levels 1 week and 15 days after the shift and the consequent changes in D-TAC doses; T3 and T6 represent the modifications in D-TAC trough levels after 3 and 6 months of follow-up, when the doses of D-TAC were fixed.