
Figures & data
Table 1 Final recorded comfort settings of the RebiSmart® device (at final injection)
Table 2 Summary of demographics of the full analysis set (n=225)
Figure 1 Box and whisker plot of percentage adherence: full analysis set over 1, 3, 6, 12, and 24 months (n=225 at all time points).
Note: *Indicates the mean; horizontal lines, the median.
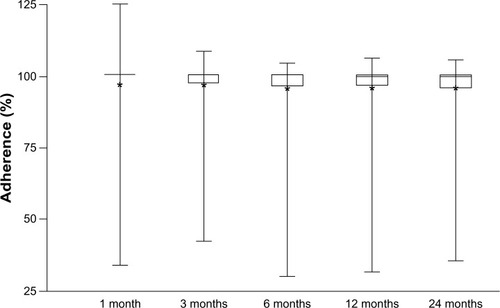
Table 3 MPR and percentage adherence of UK-based patients with multiple sclerosis at 12 and 24 months (n=161)
Table 4 Mean difference between MPR and adherence of UK-based patients with multiple sclerosis at 12 and 24 months (n=161)
Table 5 Percentage adherence by subgroup