
Figures & data
Figure 1 Dyspepsia questionnaire.
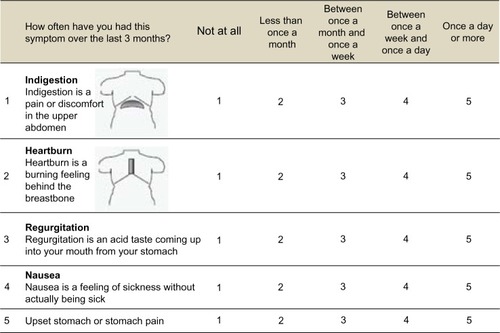
Table 1 Patient demographics
Figure 2 Analysis group definitions.
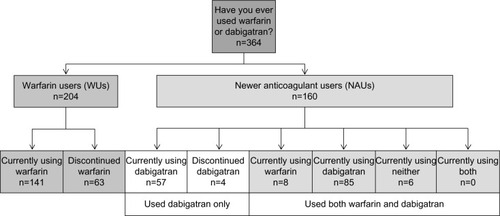
Table 2 Incidence and frequency of symptoms
Figure 3 (A) Gastrointestinal bleeding in the 3 months before the survey, (B) severity of gastrointestinal bleeding, (C) frequency of gastrointestinal bleeding, (D) duration of gastrointestinal bleeding, and (E) use of treatments for stomach-related symptoms.
Abbreviations: WU, warfarin users; NAU, newer anticoagulant users; OTC, over the counter.
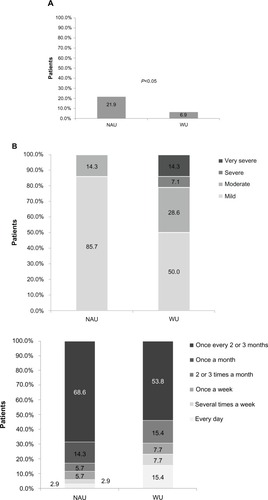
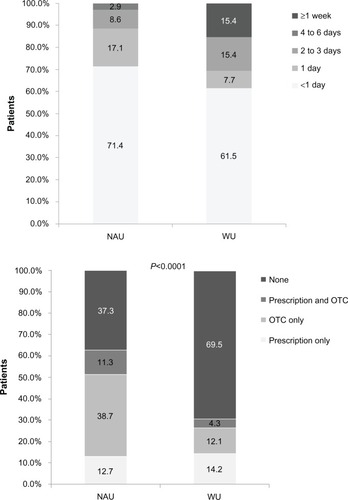
Table 3 Medication characteristics and adherence
Table 4 Treatment decisions and switching medication