Figures & data
Figure 1 Flow chart of literature screening.
Abbreviation: RCT, randomized controlled trial.
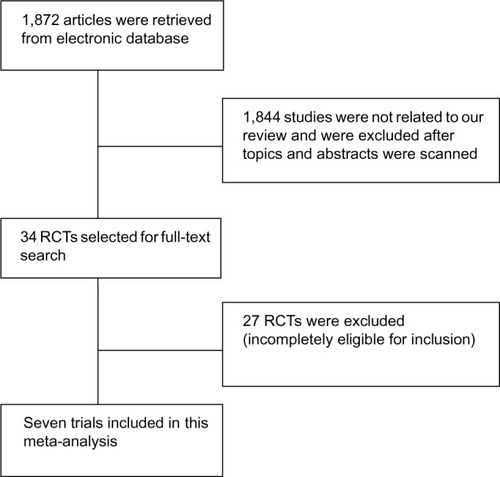
Table 1 Characteristics of included trials in this meta-analysis
Table 2 Methodological quality of included trials
Figure 2 Forest plot of the mortality compared to the thrombolysis with heparin for the patients with acute submassive PE.
Notes: The horizontal line represents 95% confidence interval of relative risk (RR), its central blue square is the position of RR, and the black diamond represents overall effect size.
Abbreviations: M–H, Mantel–Haenszel test; CI, confidence interval; PAIMS 2, Plasminogen Activator Italian Multicenter Study 2; PIOPED, Prospective Investigation of Pulmonary Embolism Diagnosis.
Abbreviations: M–H, Mantel–Haenszel test; CI, confidence interval; PAIMS 2, Plasminogen Activator Italian Multicenter Study 2; PIOPED, Prospective Investigation of Pulmonary Embolism Diagnosis.
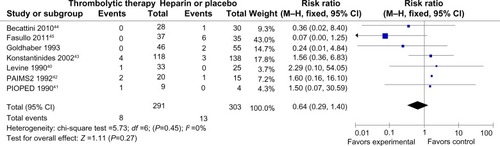
Figure 3 Forest plot of recurrent PE compared to the thrombolysis with heparin for the patients with acute submassive PE.
Notes: The horizontal line represents 95% confidence interval of relative risk (RR), its central blue square is the position of RR, and the black diamond represents overall effect size.
Abbreviations: M–H, Mantel–Haenszel test; CI, confidence interval; PAIMS 2, Plasminogen Activator Italian Multicenter Study 2; PIOPED, Prospective Investigation of Pulmonary Embolism Diagnosis.
Abbreviations: M–H, Mantel–Haenszel test; CI, confidence interval; PAIMS 2, Plasminogen Activator Italian Multicenter Study 2; PIOPED, Prospective Investigation of Pulmonary Embolism Diagnosis.
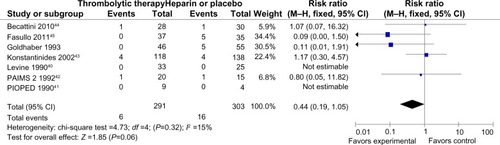
Figure 4 Forest plot of major bleeding compared the thrombolysis with heparin for the patients with acute submassive PE.
Notes: The horizontal line represents 95% confidence interval of relative risk (RR), its central blue square is the position of RR, and the black diamond represents overall effect size.
Abbreviations: M–H, Mantel–Haenszel test; CI, confidence interval; PAIMS 2, Plasminogen Activator Italian Multicenter Study 2; PIOPED, Prospective Investigation of Pulmonary Embolism Diagnosis.
Abbreviations: M–H, Mantel–Haenszel test; CI, confidence interval; PAIMS 2, Plasminogen Activator Italian Multicenter Study 2; PIOPED, Prospective Investigation of Pulmonary Embolism Diagnosis.
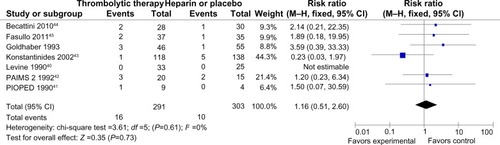
Figure 5 Forest map of minor bleeding compared the thrombolysis with heparin for the patients of acute submassive PE.
Notes: The horizontal line represents 95% confidence interval of relative risk (RR), its central blue square is the position of RR, and the black diamond represents overall effect size.
Abbreviations: M–H, Mantel–Haenszel test; CI, confidence interval; PAIMS 2, Plasminogen Activator Italian Multicenter Study 2; PIOPED, Prospective Investigation of Pulmonary Embolism Diagnosis.
Abbreviations: M–H, Mantel–Haenszel test; CI, confidence interval; PAIMS 2, Plasminogen Activator Italian Multicenter Study 2; PIOPED, Prospective Investigation of Pulmonary Embolism Diagnosis.
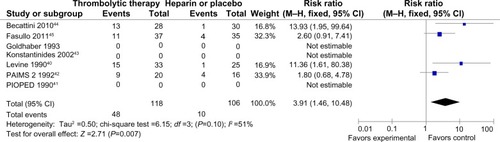
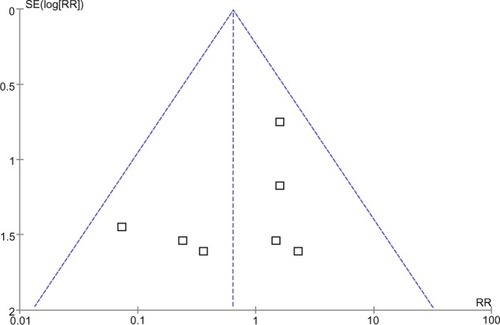
Figure 6 Funnel plot of overall effect for mortality versus study precision.
Abbreviations: SE, standard error; RR, relative risk.