
Figures & data
Table 1 Characteristics of survey participants with T2DM who were treated with antihyperglycemic agents
Figure 1 Description of population.
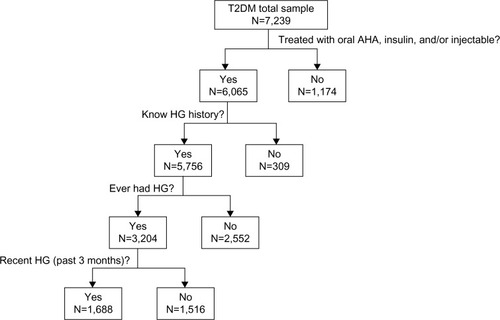
Table 2 Hypoglycemic episodes by demographic profile in participants treated with antihyperglycemic agents
Table 3 Diabetes-related clinical characteristics by hypoglycemia category in participants treated with antihyperglycemic agents
Table 4 HbA1c levels by hypoglycemia category in participants who reported HbA1c levels
Table 5 Percentage of participants reporting hypoglycemia by HbA1c level
Table 6 Morisky Medication Adherence Scale scores in participants taking antihyperglycemic agents
Figure 2 Work productivity in participants taking antihyperglycemic agents.
Abbreviation: HG, hypoglycemia.
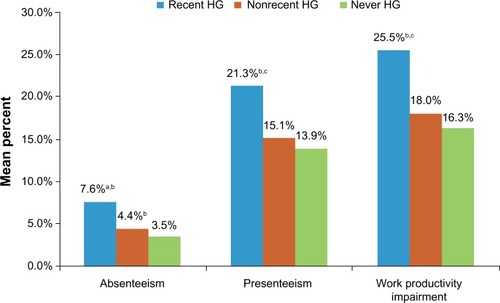
Figure 3 General health summary scores (Short Form-36) in participants taking antihyperglycemic agents who know their hypoglycemic status.
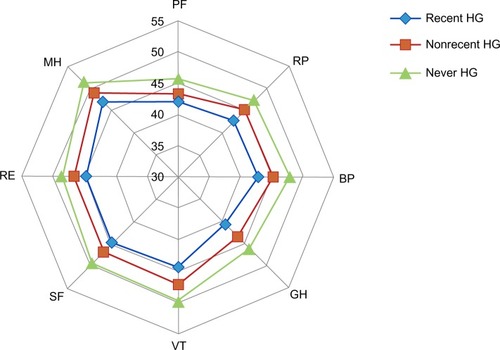
Table 7 Extent of interference with social activities in the previous 4 weeks in participants taking antihyperglycemic agents by HG experience