Figures & data
Figure 1 Graft and patient survival from the National Health Service Blood and Transplant 2011–2012 organ-donation and transplantation-activity report.Citation16
Note: Data at years 3 and 4 were linearly interpolated using values from years 2 and 5.
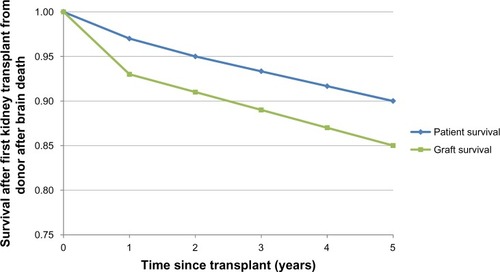
Table 1 Costs used in the base-case analysis
Table 2 Base-case results expressed as per-patient costs over a 5-year time horizon
Table 3 One-way sensitivity-analysis results
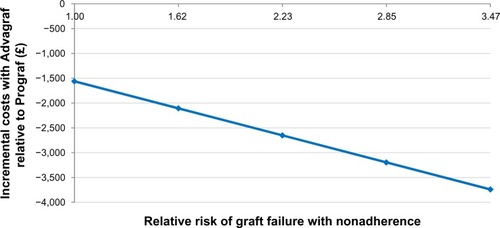
Figure 2 Incremental cost of Advagraf relative to Prograf over a range of relative risks of graft failure with poor adherence.