
Figures & data
Figure 1 Flowchart showing patient enrollment and analysis.
Abbreviations: GA, general anesthesia; PNBs, peripheral nerve blocks.
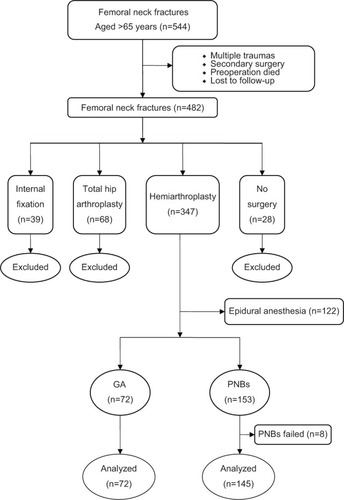
Table 1 Comparison of the demographics of 217 elderly patients between the GA and PNBs groups
Table 2 Intraoperative and postoperative data of the 217 subjects in the GA and PNBs groups
Table 3 Preoperative comorbidities, postoperative complications, and mortality of 217 elderly patients in the GA and PNBs groups
Table 4 Univariate Cox regression analysis of all variables for mortality at 30 days and 1 year postoperatively: final step
Table 5 Multivariate Cox regression analysis of variables for 30-day and 1-year mortality