
Figures & data
Figure 1 Flowchart of study participants.
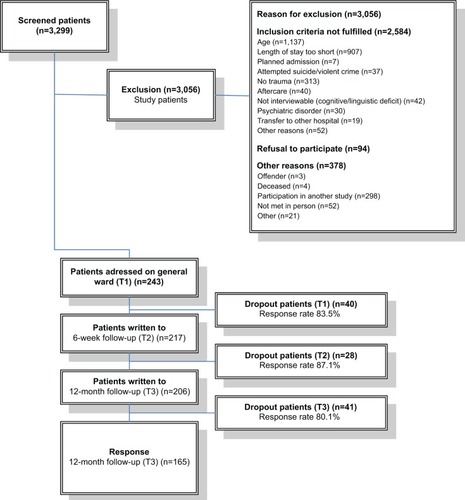
Table 1 Evaluation plan
Table 2 Patient and health-related characteristics
Table 3 Descriptive statistics for patient evaluations and outcome measures
Table 4 Patients with high versus patients with low SEMTO6W: means (two-sided t-test for independent samples), medium ranking (Mann–Whitney U-test), percentages (chi-square test), and P-values
Table 5 Patients with high versus patients with low SEMTO12M: means (two-sided t-test for independent samples), medium ranking (Mann–Whitney U-test), percentages (chi-square test), and P-values
Table 6 Results of logistic regression models with the dichotomized variable SEMTO6W after discharge as the dependent variable
Table 7 Results of logistic regression models with the dichotomized variable SEMTO12M as the dependent variable
Table 8 Comparison of the study population with dropout patients: means (t-test), percentages (chi-square test), and P-values
Table 9 Mean differences of SEMTO6W and SEMTO12M by physician empathy groups