Figures & data
Figure 1 Schematic of the theory of planned behavior model.
Notes: Adapted from AjzenCitation21 and Armitage and Conner.Citation36 The linear regression coefficients b1…3 indicate the strength of the relationships between the three constructs and intention. The correlation coefficients r12…23 show the partial correlations between the constructs.
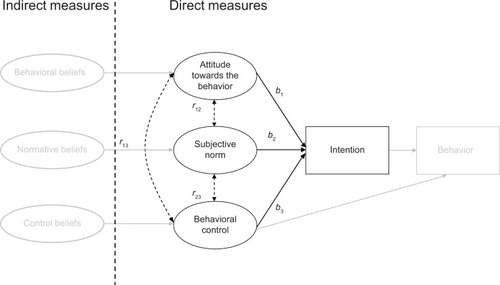
Table 1 Demographic characteristics of the participants
Table 2 Mean and standard deviation (in parenthesis) for “attitude”, “subjective norm”, “behavioral control”, and “intention” across the four stages of hearing help-seeking
Figure 2 Path models for the group data associated with different stages of the rehabilitation process.
Notes: Stage 1: Hearing problems recognized but no appointment with an ear, nose, and throat specialist yet. Stage 2: Appointment with ear, nose, and throat specialist but no hearing aids tried out yet. Stage 3: Appointment with hearing aid acoustician and hearing aids already tried out but not owned yet. Stage 4: Hearing aid owners. Bold numbers and solid lines: regression coefficients; italic numbers and dashed lines: correlation coefficients; R2: Goodness of fit of the model. *P<0.05; **P<0.01.
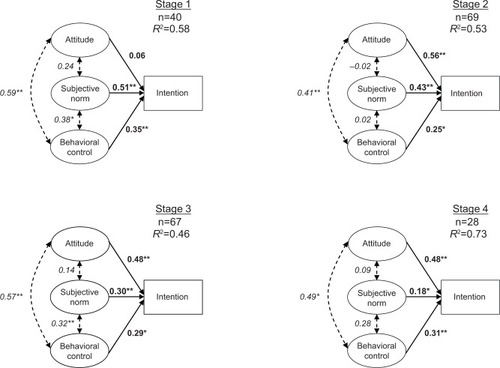
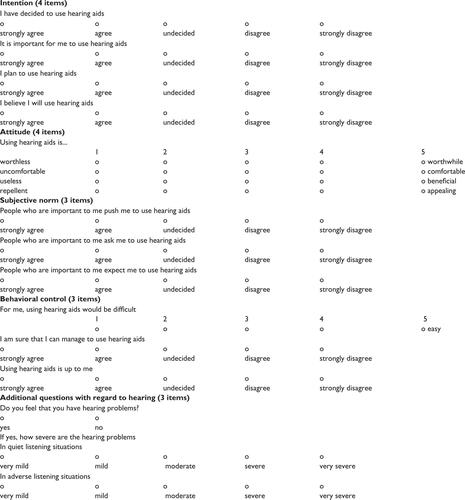
Figure S1 Theory of planned behavior questionnaire.