
Figures & data
Table 1 Characteristics of participants
Figure 1 Comparison of FBG between control and intervention groups over time (shown as median in the graph).
Notes:
z-value, Mann–Whitney U-test, *statistically significant at P<0.05; **P<0.01.
Abbreviations: FBG, fasting blood glucose; C, control group; I, intervention group; n, number of participants in each group.
Abbreviations: FBG, fasting blood glucose; C, control group; I, intervention group; n, number of participants in each group.
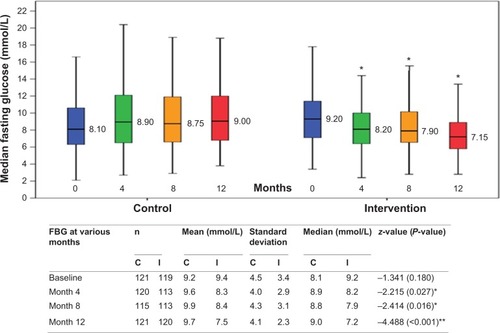
Figure 2 Comparison of HbA1c values between control and intervention groups over time (shown as median in the graph).
Notes:
z-value, Mann–Whitney U-test, *statistically significant at P<0.05; **P<0.01.
Abbreviations: HbA1c, glycated hemoglobin; C, control group; I, intervention group; n, number of participants in each group.
Abbreviations: HbA1c, glycated hemoglobin; C, control group; I, intervention group; n, number of participants in each group.
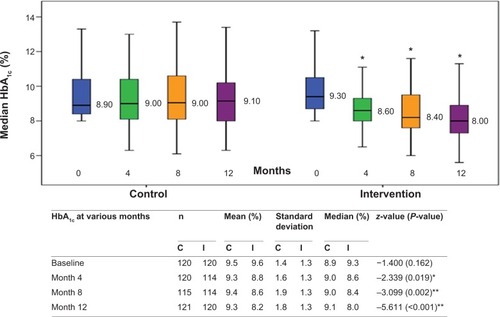
Table 2 Comparison of medication adherence between control and intervention groups based on three levels of adherence
Table 3 Comparison of medication adherence between control and intervention groups when classified as nonadherence and adherence
Table 4 Comparison of fasting blood glucose and glycated hemoglobin (HbA1c) within control and intervention groups over the study period