
Figures & data
Table 1 Demographics of the study population
Table 2 Demographics of respondents of the telephone surveys compared to the nonrespondents
Figure 1 Pie charts showing the major groupings of reasons for not attending further sessions in the dry eye clinic for (A) all respondents and (B) those respondents who attended only once before they became LTF.
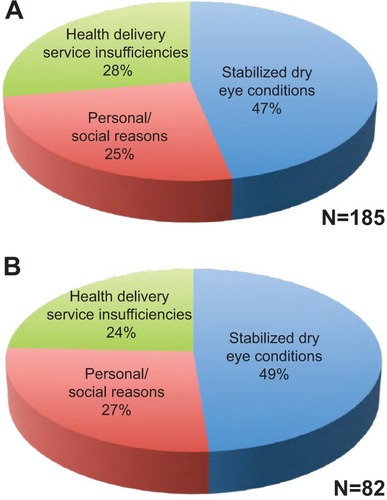
Table 3 Reasons for not attending the dry eye clinic
Figure 2 The proportion of patients stating certain reasons for not attending further sessions for all respondents of the telephone survey (A, D, G), respondents who attended only once (B, E, H) before becoming LTF, and respondents who attended more than one (C, F, I) clinic visit before becoming LTF.
Abbreviations: LTF, lost to follow-up; N, number; SNEC, Singapore National Eye Center.
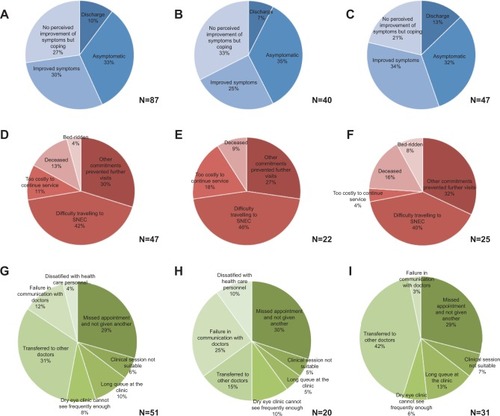
Figure S1 Flow chart showing the study process with the number of participants.
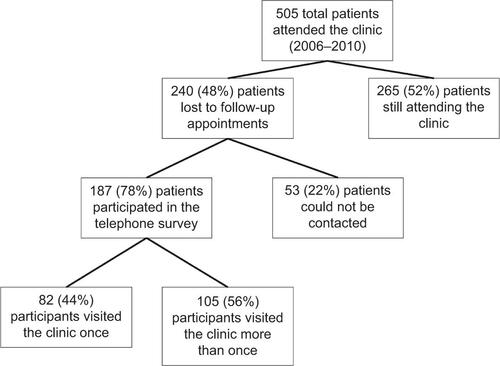
Figure S2 Bar charts showing number of visits those patients had consulted the dry eye service clinic before loss to follow-up.
Notes: (A) The respondents who had been contacted by the telephone survey (n=187). (B) Those patients who could not be contacted (n=53).
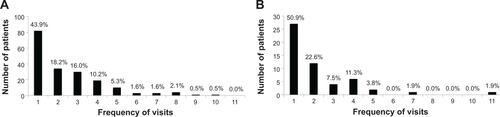
Table S1 Patients attending the dry eye clinic with systemic disease